

Influence of Filter Face Velocity on the Collection Efficiency of HEPA Filters and the Achievement of Cleanliness Classes in Cleanrooms
1 Problem Statement
To prevent product contamination by airborne particulate impurities, HEPA filters (High Efficiency Particulate Air filters) are used in cleanroom technology. Only through high collection efficiencies of more than 99.9% can product protection and the particle number concentrations specified in standards [4] and guidelines [3] for ultra-clean areas be achieved.
The collection efficiency of HEPA filters is determined by the filter manufacturer in accordance with DIN EN 1822-1 [1] under defined conditions, in particular a defined filter face velocity of 0.45 m/s. In subsequent operation, however, different face velocities may occur, partly due to fluctuations in fan drive power or due to the local installation situation, for example in a pressure plenum.
It is known from filter theory [7] and experimental studies [6] that the collection efficiency of HEPA filters decreases as the filter face velocity increases. Furthermore, the Most Penetrating Particle Size (MPPS) shifts toward smaller particle sizes.
In the context of this Technical Report, the influence of the filter face velocity on the collection efficiency of HEPA filters and the influence on achieving the cleanliness class are demonstrated.
2 Requirements from Standards and Guidelines
2.1 Cleanroom Classification
According to the GMP Guidelines [3], cleanrooms are divided into four classes: A, B, C, and D. In addition, a distinction is made between the operating states “at rest” and “in operation.” Table 1 lists the particle number concentrations specified in the GMP Guidelines for achieving the respective cleanliness classes. A finer subdivision can be found in ISO 14644-1 [4]. The limit particle number concentrations are determined using Equation 1.
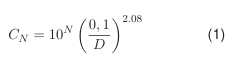
N is the cleanliness class, D is the particle size considered in µm. The cleanliness class can be specified with one decimal place. For N = 5, ISO Class 5, this results in a particle number concentration per m³ of 3520, which corresponds to Grade A according to the GMP Guidelines. When determining the cleanliness class, the particle concentration is determined in the cleanrooms at a number of measuring positions depending on the floor area. The cleanliness class is determined from the mean value [4]. Usually, when using HEPA filters, the flow velocity and its uniformity are evaluated and a filter integrity test is performed before the cleanliness class is determined. Corresponding tests are described in ISO 14644-3 [5]. The evaluation of the flow velocity and uniformity is carried out on the downstream side of the filter using a grid measurement. For Grade A areas, a target value of 0.45 m/s with a tolerance range of ± 20% (0.36 m/s to 0.54 m/s) is specified. During the filter integrity test, particles are introduced on the upstream side of the filter and the entire filter is scanned on the downstream side. However, this is not a repetition of the test performed by the filter manufacturer for filter classification. Rather, this test is intended to prove the functionality of the filter after installation. Furthermore, the evaluation is not performed at the Most Penetrating Particle Size (MPPS).
Light-scattering measuring devices are used to determine particle number concentrations. This type of device offers sufficient measurement accuracy in the particle size range from 0.3 µm to 5.0 µm and is therefore suitable for cleanliness class determinations of cleanrooms and clean areas in the pharmaceutical environment, as the number concentrations for particle sizes 0.5 µm and 5.0 µm must be determined according to the GMP Guidelines. For smaller particles in the size range below 0.1 µm, however, the evaluation unit can no longer distinguish the signal attributable to particle scattering from the background noise. In this size range, condensation nucleus counters are therefore preferred, as is usually the case for filter classification according to DIN EN 1822 [1]. For particles larger than 5.0 µm, collection losses in the supply lines primarily lead to a decrease in measurement accuracy [8]. A typical course of counting efficiency according to [8] is shown in Figure 1.
![Table 1: Limit particle concentrations according to GMP Guidelines [3]](https://www.dphe.de/wp-content/uploads/2025/05/image-224.png)
![Fig. 1: Counting efficiency curve of a light-scattering measuring device according to [8]](https://www.dphe.de/wp-content/uploads/2025/05/image-225.png)
Fig. 1: Counting efficiency curve of a light-scattering measuring device according to [8]
2.2 HEPA Filter Classification
According to DIN EN 1822 [1], an individual test of each HEPA filter must be carried out from filter class H13 onwards. Type testing, as with coarse, medium, and fine dust filters [2], is not permitted. To determine the filter class, the HEPA filter is completely scanned on the downstream side. The filter collection efficiency and thus the filter class result from the ratio of the particle concentrations on the downstream and upstream sides. Local fluctuations are accepted. Repairing the filters, e.g., by sealing areas with increased particle penetration, is also permitted. Table 2 lists the required collection efficiencies for HEPA filters.
The measurement is carried out at an average filter face velocity of 0.45 m/s related to the filter cross-sectional area and at the particle size with the lowest collection rate, the Most Penetrating Particle Size (MPPS). The MPPS is the particle size that can pass through the filter most easily without being collected. The collection minimum lies in the range of 0.1 µm and results from the decreasing inertial collection for large particles while diffusion collection for small particles is still low [7]. The MPPS is determined beforehand by the filter manufacturer or filter media supplier based on measurements on the flat sheet material [1]. A typical curve is shown in Figure 2.
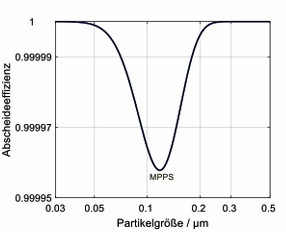
Fig. 2: Typical course of the collection efficiency curve of a HEPA filter
3 Influence of Face Velocity on the Collection Efficiency of HEPA Filters
Due to the high void fraction of usually more than 80% in filter media used in HEPA filters, the collection behavior of individual fibers or fiber fields is used as the basis for calculating the collection efficiency of the entire filter and extrapolated to an entire filter [7]. The collection of particles on the individual fiber results in the typical curve with a minimum for particles in the size range of approx. 0.1 µm (see also previous chapter and Figure 2).
The collection efficiency depends on the filter face velocity. At lower face velocities, particles are collected more effectively. Furthermore, there is a shift of the MPPS toward larger particle sizes.
Figure 3 shows the dependence of the collection efficiency on the filter face velocity for an H13 filter. The collection efficiency of 99.95% at the MPPS required to achieve the H13 filter class is still reached at a face velocity of 0.54 m/s. At face velocities of 0.90 m/s and 1.35 m/s, however, the required collection efficiency is not met. A reduction of the face velocity to 0.36 m/s leads to an improvement. Furthermore, it can be seen that changes in the collection efficiency only occur in the particle size range from 0.02 µm to 0.5 µm. Outside this range, all particles continue to be completely collected regardless of the filter face velocity.
![Table 2: Specifications for collection efficiency or particle penetration according to DIN EN 1822 [1]](https://www.dphe.de/wp-content/uploads/2025/05/image-227.png)
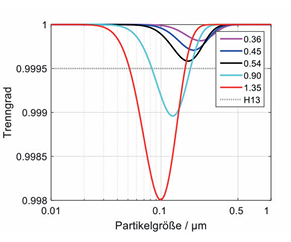
Fig. 3: Collection efficiency curves of an H13 filter as a function of the filter face velocity
For clarification, all variants in Figure 4 were related to the separation efficiency calculated with a face velocity of 0.45 m/s. At velocities below 0.45 m/s (0.36 m/s), the ratio is below 1 over almost the entire particle size range, which corresponds to an improvement in the collection efficiency. Only in the range of 0.3 µm is there a slight deterioration, caused by the shift of the MPPS to larger particle sizes.
Also due to the shift of the MPPS, a slight improvement in the collection efficiency can be observed at higher face velocities in the range of 0.3 µm. However, the improvement is compensated by the significant decrease in the range of approx. 0.1 µm.
The local deviations for the individual particle sizes add up to the cumulative total deviations shown in Figure 5. The cumulative total deviation was calculated as follows:
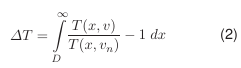
Accordingly, a tripling of the average filter face velocity from 0.45 m/s to 1.35 m/s leads to a reduction in the collection efficiency of around 11% for particle sizes greater than or equal to 0.02 µm. For particle sizes above 0.5 µm, on the other hand, there is no deviation.
4 Influence of Face Velocity on Achieving the Cleanliness Class
As shown in the previous section, at face velocities of more than 0.45 m/s, a slight improvement in the collection efficiency in the particle size range of 0.3 µm is followed by a significant deterioration in the overall collection efficiency. For example, for a face velocity of 1.35 m/s, the reduction in collection efficiency adds up to around 11% if the collection efficiency at 0.45 m/s is taken as a reference. Assuming that the cleanliness class is just barely achieved for each particle size at a face velocity of 0.45 m/s, the specifications would consequently no longer be met at higher face velocities and for particle sizes of less than 0.3 µm.
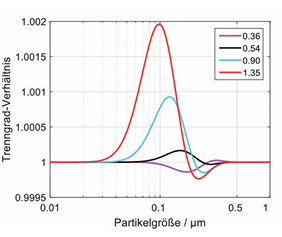
Fig. 4: Separation efficiency ratios of an H13 filter related to the separation efficiency calculated with a face velocity of 0.45 m/s
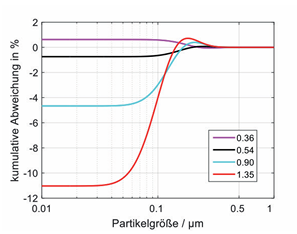
Fig. 5: Cumulative total deviations according to Equation 2
For clarification, Figure 6 shows the absolute deviations in particles per m³ for ISO cleanliness class N = 5 (Grade “A”). The deviations were calculated as described in Equation 3.

C′N is the particle number concentration at face velocities deviating from 0.45 m/s. In addition, the rounding error permitted according to ISO 14644-1 [4] is shown, which results from specifying the particle number concentrations to three significant figures. For ISO cleanliness class N = 5, the values listed in Table 3 result. D was determined by rearranging Equation 1.
Table 3: Rounding error permitted according to ISO 14644-1 [4], due to specifying the particle number concentrations to three significant figures
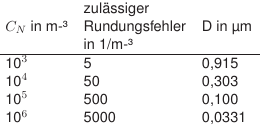
Figure 6 shows that at face velocities of more than 0.45 m/s, there is initially a decrease in the particle number concentration in the particle size range of approx. 0.23 µm. Below a particle size of approx. 0.13 µm, however, the particles are collected significantly less effectively. The differences are clearly outside the range of the rounding error. For face velocities of less than 0.45 m/s, the deviation from a particle size of approx. 0.18 µm is outside the range of the rounding error.
A significant difference therefore only occurs at particle sizes that are significantly below the lower limit particle size of 0.5 µm usually used in cleanliness class measurements. In the particle size range of 0.2 µm, there is also a significant decrease in the particle counting efficiency of the measuring devices (see Figure 1). Consequently, the changes in particle collection efficiency caused by both an increase and a decrease in the filter face velocity are only slightly measurable and have no influence on the cleanliness class.
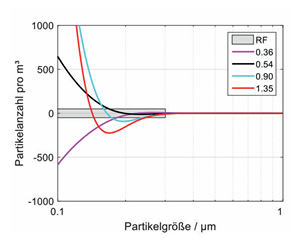
Fig. 6: Deviations in particle number concentration according to Equation 3
The absolute particle number concentrations are shown in Figure 7 and Figure 8. These representations also clarify that significant differences only exist from particle sizes of less than 0.1 µm. Furthermore, the changes are so small that even a tripling of the filter face velocity (1.35 m/s) does not result in a drop to ISO Class 5.1.
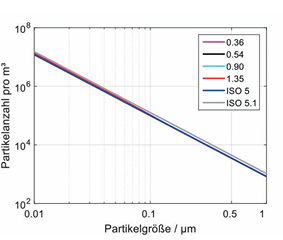
Fig. 7: Limit particle concentrations according to Equation 3 and for ISO cleanroom classes N=5 and N=5.1
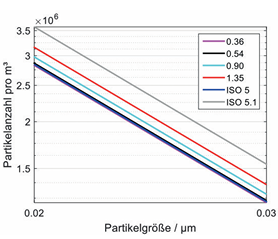
Fig. 8: Limit particle concentrations according to Equation 3 and for ISO cleanroom classes N=5 and N=5.1
5 Summary
In this Technical Report, the influence of the filter face velocity on the collection behavior of HEPA filters and on achieving the cleanliness class in cleanrooms was demonstrated. The evaluations were based on calculations of the collection efficiency of HEPA filters at different face velocities. Using the ratio of the collection efficiencies, the influence of the face velocity on achieving the cleanliness class was estimated. It was shown that when the filter face velocity is increased to over 0.45 m/s, a slight improvement in the collection efficiency in the particle size range of 0.3 µm is followed by a significant deterioration in the overall collection efficiency. The reduction in collection efficiency adds up to a cumulative total deviation of 11% when the filter face velocity is tripled from 0.45 m/s to 1.35 m/s. Due to the characteristic course of the separation efficiencies, with a collection minimum at approx. 0.1 µm (MPPS), there is no change in the collection efficiency for particle sizes above 0.5 µm. Since particle sizes of more than 0.5 µm are generally evaluated when determining the cleanliness class, neither an increase nor a decrease in the filter face velocity has an influence on the cleanliness class of the cleanrooms or clean areas.
References
1
DIN EN 1822-1: 2011: High efficiency air filters (EPA, HEPA and ULPA) – Part 1: Classification, performance testing, marking
2
DIN EN 779:2012-10: Particulate air filters for general ventilation – Determination of the filtration performance
3
EU Guidelines to Good Manufacturing Practice, Volume 4, Annex 1: Manufacture of Sterile Medicinal Products – revision November 2008
4
ISO 14644-1:2015-1 Cleanrooms and associated controlled environments – Part 1: Classification of air cleanliness by particle concentration
5
ISO 14644-3:2005-03: Cleanrooms and associated controlled environments – Part 3: Test methods
6
BAUMGARTNER, Hanspeter: Electret fiber layers for aerosol filtration – Investigations on the fiber charge state and collection characteristics, University of Karlsruhe, Dissertation, 1987
7
BROWN, R. C. (Ed.): Air Filtration – An Integrated Approach to the Theory and Applications of Fibrous Filters. New York: Pergamon, 1993
8
GAIL, L.; GOMMEL, U.; HORTIG, H.-P.: Cleanroom Technology. 3rd ed. Heidelberg: Springer, 2012