
Pressure in Sealed Containers During Steam Sterilization of Aqueous Preparations
1 Introduction
A rapid, reliable, and therefore frequently used method for sterilizing aqueous preparations in their final containers is steam sterilization in an autoclave. We consider, by way of example, injection and infusion bottles as the most commonly used packaging materials for parenterals, as well as pre-filled syringes.
The primary packaging materials are suitably pre-treated. For example, glass bottles are first washed, sterilized, and depyrogenated. Subsequently, they are filled with the aqueous preparation and sealed with stoppers. The stoppers of bottles are secured by crimp caps. For pre-filled syringes, the stopper is only pressed in, as it must be moved during application. The containers are placed in a sterilizer using suitable holding devices and loading carts and sterilized with steam at 121°C and 2 bar (0.2 MPa).
Textbooks on Pharmaceutical Technology, e.g., [2, 12], point out the specific nature of sterilizing liquids in closed containers. An internal pressure builds up in these containers, which can lead to bursting. Voigt [11] presented a table for the internal pressure and the resulting differential pressure to the sterilization chamber at various fill levels, but no calculation method was provided. When using the steam-air mixture process, this differential pressure, also called support pressure, must be compensated by means of injected, sterile compressed air. Therefore, an accurate calculation depending on the fill level and other influences is desirable. Some mechanisms of internal pressure increase have already been described for various forms of primary packaging, see [3], [10], [7], and [4].
First and foremost, the fundamental work by Beck [3] must be mentioned. More than 35 years ago, he developed a calculation equation for the pressure in sealed bottles during heating in an autoclave. Unfortunately, his publication was marred by numerous typographical errors. Even in his erratum, printed several months later, not all typographical errors were identified and corrected. This still erroneous equation was later reprinted in the work by Joyce and Lorenz [7]. The objective of this report is therefore to explain the fundamentals of Beck’s pressure equation, derive its correct form, and demonstrate its application.
2 Mechanisms of Pressure Increase
The liquid level divides the container’s interior into the headspace with the gas phase and the product space with the liquid phase. The gas phase consists of an air-water vapor mixture that rapidly reaches saturation after the container is sealed. The associated change in liquid level due to mass loss of the liquid will be neglected here.
Pharmaceutical products as aqueous solutions of small molecules, e.g., isotonic saline solution, contain dissolved substances only in very low concentrations. Large molecules, e.g., proteins as active ingredients or polymeric scaffolding agents in gels, cause only a very slight reduction in vapor pressure even at high concentrations. Therefore, for simplification, the liquid phase is considered as pure water. The volume of the entire interior of our container model is denoted by V, the volume of the headspace by Vg (index g = gas phase), and the volume of the product space by Vf (index f = liquid phase).$$V = V_g + V_f$$
The proportion of the headspace volume to the total
volume is $$y = V g /V$$ and the proportion of the
product space (fill level) corresponds to:$$1 – y = V_f/V$$
The initial state (index 1) is defined by temperature T1, pressure p1, and volume fraction y1. The heating of the container should occur slowly enough that a thermodynamic equilibrium (index 2) is established at each new state. In particular, unsteady heat conduction and heat storage effects are to be neglected. If y1 and y2 known, the change in the volume fraction can be expressed using a so-called compression factor f y:
$$f_y = rac{y_1}{y_2}$$
The following effects cause a pressure increase in the container:
1. The container expands as the temperature increases, and its volume increases from V 1 to V 2. This will slightly decrease the pressure.
2. Part of the liquid evaporates until a new saturation state is reached. The partial pressure of water vapor rises to the value of the saturation vapor pressure pDS,2.
3. The partial pressure of air increases with temperature according to the ideal gas law.
4. The liquid phase expands due to the temperature change, meaning the liquid level rises and, in turn, compresses the gas phase (y2 < y 1). The liquid itself is assumed to be incompressible; that is, the compression of water due to the pressure increase can be neglected compared to the gas phase.
5. A portion of the air dissolved in the liquid in the initial state will degas into the headspace as temperature rises due to decreasing solubility, thereby contributing further to the pressure increase in the container. Above a certain partial pressure of air, this effect reverses, and the air redissolves in the liquid as pressure increases.
3 Container Expansion
If we reduce the container to a cylinder closed on all sides, the volume of our container model can be described as follows:
$$V = \frac{\pi}{4} D^2 L,$$
where D = the inner diameter and L = the inner length of the cylinder. When the cylinder is heated, its volume increases:
$$\frac{dV}{V} = 2 \cdot \frac{dD}{D} + \frac{dL}{L}$$
The law of linear expansion is as follows:$$\frac{dD}{D} = \frac{dL}{L} = \alpha dT$$
Thus, we obtain for the relative volume increase:$$\frac{dV}{V} = 3\alpha dT$$
For a finite temperature increase dT = T₂ – T₁ we obtain
$$dV_1 = 3\alpha dT V_1 $$
$$V_2 = V_1 + dV_1 $$
$$V_2 = V_1 [1 + 3\alpha(T_2 – T_1)],$$
where the linear expansion coefficient α is assumed to be constant here. The compression factor fα is defined here with the volume of the container before and after the state change.
$$f_\alpha = \frac{V_1}{V_2}$$
4 Pressure in the Gas Phase
According to Dalton’s law, the total pressure in the gas phase is equal to the sum of the partial pressures. The air is saturated, so the partial pressure of water vapor corresponds to the saturation vapor pressure.
$$p_1 = p_{L,g,1} + p_{W,g,1} = p_{L,g,1} + p_{DS,1} $$
$$p_2 = p_{L,g,2} + p_{W,g,2} = p_{L,g,2} + p_{DS,2}$$
The partial pressure of air is now expressed with the total pressure and the saturation vapor pressure.
$$p_{L,g,1} = p_1 – p_{DS,1}$$
$$p_{L,g,2} = p_2 – p_{DS,2}$$
The unknown partial pressure of air in state 2 can be easily determined because p/T=constant.
$$p_{L,g,2} = p_{L,g,1} \frac{T₂}{T_1} = (p_1 – p_{DS,1}) \frac{T_2}{T_1}$$
Thus, the pressure for an isochoric state change with a constant volume and without change in masses in the gas phase is obtained.
$$p_2 = (p_1 – p_{DS,1}) \frac{T_2}{T_1} + p_{DS,2}$$
At this point, the thermal compression factor fᴛ will be introduced as an auxiliary variable, which dimensionlessly expresses the temperature influence
$$f_T = \frac{T_2}{T_1}$$
5 Vapor Pressure and Density of Water
5.1 Saturation Vapor Pressure of Water
According to the International Steam Tables of 1997 [1], the saturation vapor pressure pDS in MPa is calculated as follows:
$$
\frac{p_{DS}}{p^\ast} = \left[ \frac{2C}{B + \sqrt{-B^2 – 4AC}} \right]^4
$$
with p* = 1 MPa, an auxiliary variable for generating a dimensionless pressure quantity. The other auxiliary variables have the following meaning:
$$A = n_0 \vartheta^2 + n_1 \vartheta + n_2 $$
$$B = n_3 \vartheta^2 + n_4 \vartheta + n_5 $$
$$C = n_6 \vartheta^2 + n_7 \vartheta + n_8$$
and the dimensionless temperature ϑ used therein is defined as follows:
$$\vartheta = \frac{T_s}{T^\ast} + \frac{n_9}{\frac{T_s}{T^\ast} + n_{10}}$$
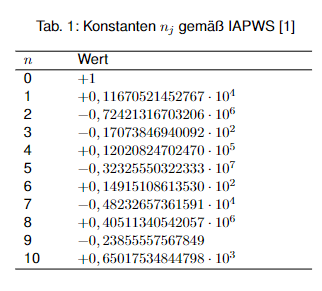
with Ts = thermodynamic temperature at the saturation point and T* = 1 K, an auxiliary variable for generating a dimensionless temperature. The constants nj used are listed in Tab. 1.
5.2 The Density of Liquid Water
As temperature increases, liquid water expands and its density decreases, leading to a pressure increase in the container. The density at saturation can be calculated as follows using the constants from Tab. 2, according to material data sheet 11 of the PTB [9].
$$\varrho_r = 1 + \sum_{i=2}^6 A_i (1 – T_r)^{a_i}$$
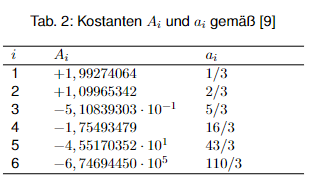
with T r = reduced temperature and %r = reduced density. The reduced quantities are defined as follows using the critical quantities Tc and ϱc:
$$T_r = \frac{T}{T_c} \quad \text{mit} \quad T_c = 647.096 \, \text{K}$$
$$\varrho_r = \frac{\varrho}{\varrho_c} \quad \text{mit} \quad \varrho_c = 322 \, \text{kg/m}^3$$
The density ϱ calculated in this way will later be incorporated into the temperature-dependent mass balance of water as ϱw,f.
6 Solubility of Air in Water
6.1 Specific Gas Constants
For the later derivation of the pressure equation and its calculation, the molar masses and specific gas constants of air and water are required. The molar masses of air and water have the following values according to IUPAC-97 [6]:
$$M_{L} = 28.963 \text{ g/mol} $$
$$M_{W} = 18.015257 \text{ g/mol}$$
The molar gas constant is given as Rₘ = 8.314472 J/molK according to CODATA 2018 [8]. This allows the specific gas constants of air and water to be determined:
$$ R_L = R_m / M_L = 287.072196 \text{ J/(kgK)} $$
$$ R_W = R_m / M_W = 461.523918 \text{ J/(kgK)} $$
6.2 Henry’s Law
In ideally dilute solutions, Henry’s Law applies. Applied to the air-water material pair, it states that the mole fraction xL,h (index h for dissolved) of air dissolved in water is proportional to the partial pressure pL,g that the air exerts above the water level.
$$ p_{L,g} = H x_{L,h} $$
The proportionality constant H is called Henry’s constant. It is a material constant that generally depends on the gas-liquid material pair and on temperature. The mole fraction of dissolved air is expressed as follows:
$$x_{L,h} = \frac{n_{L,h}}{n_{L,h} + n_W}$$
with n L,h = amount of substance of air in mol dissolved in water, and n w = amount of substance of pure water in mol in which the air is dissolved. Because the amount of dissolved air is much smaller than that of water, Equation 5 can be simplified as follows:
$$ x_{L,h} \approx \frac{n_{L,h}}{n_W} \quad \text{wegen} \quad n_{L,h} \ll n_W $$
For the amount of dissolved air, we thus obtain the following expression:
$$ n_{L,h} = \frac{n_W}{H} \cdot p_{L,g} \quad (6) $$
For the later mass balance, we replace the amounts of substance in Eq. 6 with masses using the following equations:
$$m_{L,h} = n_{L,h} M_L $$
$$m_W = n_{W,f} M_W$$
and thus the expression for the mass of dissolved air:
$$ m_{L,h} = m_W \frac{M_L}{M_W} p_{L,g} \frac{1}{H} $$
$$ = \varrho_W (1-y)V \frac{M_L}{M_W} (p – p_{DS}) \frac{1}{H} $$
6.3 Temperature Dependence of Henry’s Constant
Henry’s constant H for the air-water material pair depends on temperature: the higher the water temperature, the less air can be dissolved in the water. At very high pressures, H also depends on pressure. This pressure dependence can be neglected for the pressures in question here.
In Dorsey [5] (Table 232/III, p.: 539), values for 1/H were tabulated in the temperature range 0°C ≤ t ≤ 100°C. The values were given with the unit 10⁻⁹ /mm Hg. From this, the reciprocal H was formed here and converted to the unit atm to allow comparability with Beck’s formulation. Subsequently, the values were converted to the unit Pa to be used in the pressure equation in an SI-compliant manner.
6.4 Example
At 20°C, the Dorsey table shows the
value: 1/H = 19.82 10⁻⁹/mm Hg. The conversion to the SI unit is as follows:
$$ rac{1}{H} = 19.82 rac{10^{-9}}{mmHg} rac{760 ext{ mmHg}}{101,325 ext{ Pa}} $$
$$ = 1.4866 cdot 10^{-1} / ext{Pa} $$
Thus, at 20°C, we obtain Henry’s constant with H20 = 6.7267 10⁹ Pa = 6.6387 10⁴ atm. In Beck [3], the following formulation of Henry’s constant is found:
$$ \frac{H}{H_{20}} = 1.627 – \frac{223}{T} \exp \left[ -\left( \frac{T – 273.2}{45} \right)^2 \right] \quad (7) $$
where H₂O assumes a value of 6,64 10⁴ atm, which is in good agreement with Dorsey’s table value. According to [3], temperature T is inserted in K in Eq. 7 to obtain H in atm. Beck’s equation provides good approximations for t > 20°C compared to Dorsey’s table values. Below 20°C, Beck’s approximation equation is too inaccurate. Therefore, a separate approximation equation (Eq. 8) for the temperature dependence of Henry’s constant was developed here to remain free in the choice of reference point and to obtain higher accuracy. The constants bₖ are listed in Tab. 3.
$$ rac{H_0}{H} = exp left[ -left( rac{t}{65} ight)^2 ight] – sum_{k=0}^5 b_k cdot t^k quad (8) $$
Equation 8 is valid in the range 0°C ≤ t ≤ 140°C with Hₒ = Hₜ = 0°C = 4.3698 · 10⁹ Pa or = 4.3698 · 10⁴ atm. To abstract the influence of solubility, a compression factor will again be introduced. The formulation of the compression factor fₕ (see Eq. 29) sets the Umstellung Tab. 3: Konstanten der Approximationsgleichung 8
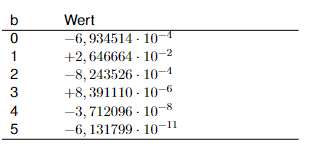
der Massenbilanzen voraus, welche im nächsten Abschnitt vorgenommen werden.
7 The Pressure Equation
7.1 Procedure
The goal is to establish an explicit expression for calculating pressure p₂. The development of the pressure equation proceeds in four steps:
- Establishment of the mass balance of water and rearrangement according to the volume fraction y₂ of the gas phase due to the temperature change from T₁ to T₂,
- Establishment of the mass balance of air for both states,
- Combination of the mass balances to formulate an implicit equation (Eq. 26) for pressure p₂,
- Rearrangement into an explicit expression for pressure p₂ (Eq. 28).
7.2 Water Mass Balance
The mass of water in the product space (mass of the liquid phase) and the mass of water vapor in the headspace must be equal before and after the state change.
$$ \left. m_{w,f} + m_{w,g} \right|_{1} = \left. m_{w,f} + m_{w,g} \right|_{2} \quad (9) $$
The mass of liquid water without dissolved components in state 1 is described by
$$m_{w,f,1} = \varrho_{w,f,1} V_{w,f,1} = \varrho_{w,f,1} (1-y_1)V_1 \quad (10)$$
and the mass of liquid water in state 2 accordingly by
$$m_{w,f,2} = \varrho_{w,f,2} V_{f,2} = \varrho_{w,f,2} (1-y_2)V_2. \quad (11)$$
For better clarity, the index “D” for gaseous water vapor will now replace the index “w,g”, and the index “W” for liquid water will replace the index “w,f”. The mass of water vapor in state 1 is described by
$$m_{D,1} = \varrho_{D,1} V_{g,1} = \varrho_{D,1} y_1 V_1$$
$$= \frac{p_{DS,1}}{R_D T_1} y_1 V_1 \quad (12)$$
and the mass of water vapor in state 2 accordingly by
$$ m_{D,2} = \varrho_{D,2} V_{g,2} = \varrho_{D,2} y_2 V_2 $$
$$ = \frac{p_{DS,2}}{R_D T_2} y_2 V_2. \quad (13) $$
If equations 10 to 13 are inserted into Eq. 9, the following relationship for the volume fraction of the headspace in state 2 results:
$$ y_2 = \frac{1 – \frac{\varrho_{w,1}}{\varrho_{w,2}} \left[ 1 – y_1 \left( 1 – \frac{\varrho_{D,1}}{\varrho_{w,1}} \right) \right] \frac{V_1}{V_2}}{1 – \frac{\varrho_{D,2}}{\varrho_{w,2}}} \quad (14) $$
The density of vapor is much smaller than the density of liquid water
$$ \left. \frac{\varrho_D}{\varrho_W} \right|_1 \quad \text{or} \quad \left. \frac{\varrho_D}{\varrho_W} \right|_2 \ll 1 \quad (15) $$
and Eq. 14 can be simplified:
$$ y_2 \simeq 1 – \frac{\varrho_{W,1}}{\varrho_{W,2}} (1 – y_1) \frac{V_1}{V_2} \quad (16) $$
If the volume expansion of the container according to Eq. 2 is now considered, Eq. 16 can be written as follows:
$$ y_2 \simeq \frac{\varrho_{w,1}}{\varrho_{w,2}} \left[ \frac{1 – y_1}{1 + 3 \alpha (T_2 – T_1)} \right] \quad (17) $$
7.3 Air Mass Balance
The mass of air in the headspace and the mass of air dissolved in water must also be equal before and after the state change.
$$ m_{L,g} + m_{L,h} \bigg|_1 = m_{L,g} + m_{L,h} \bigg|_2 $$
The mass of the air component in the gas phase of the headspace in state 1 is described by
$$ m_{L,g,1} = \varrho_{L,g,1} \, y_1 \, V_1 \quad (19) $$
At the same time, with the ideal gas equation,
$$pV = mRT\text{ or }\varrho_{L,g,1} = p_{L,1} / (R_L T_1)$$
$$ m_{L,g,1} = \frac{p_{L,1}}{R_L T_1} y_1 V_1 \quad (20) $$
$$ = \frac{p_{L,1} M_L}{R_M T_1} y_1 V_1 $$
or
$$ m_{L,g,1} = (p_1 – p_{DS,1}) \frac{M_L}{R_M T_1} y_1 V_1 \quad (21) $$
and in state 2, accordingly,
$$m_{L,g,2} = \varrho_{L,2} y_{2} V_{2} \quad (22)$$
$$ \frac{p_{L,2}}{R_{L} T_{2}} y_{2} V_ {2} = (p_{2} – p_{DS,2}) \frac{M_{L} y_{2} V_{2}}{R_ {M} T_{2}} \quad (23) $$
For the mass of air dissolved in the liquid, the following applies:
$$m_{L,f,1} = \varrho_{w,1} (1 – y_{1}) V_{1} (p_{1} – p_{DS,1}) \frac{M_{L}}{M_{W}} \frac {1}{H_{1}} \quad (24)$$
and
$$m_{L,f,2} = \varrho_{w,2} (1 – y_{2}) V_{2} (p_{2} – p_{DS,2}) \frac{M_{L}}{M_{W}} \frac {1}{H_{2}} \quad (25)$$
7.4 Implicit Equation According to Beck
Equations 20 to 25 are now inserted into the
balance equation 18. This yields
an implicit expression for pressure p₂.
$$ \frac{p_{2} – p_{DS,2}}{p_{1} – p_{DS,1}} = \frac{\frac{y_{1}}{R_{m}T_{1}} + \varrho_{w,1} \frac{(1 – y_ {1})}{M_{W}H_{1}}}{\frac{y_{2}}{R_{m}T_ {2}} + \varrho_{w,2} \frac{(1 – y_{2})}{M_{W}H_{2}}} \frac{V_{1}}{V_ {2}} \quad (26) $$
Rearrangement yields the equation published by Beck, which, after incorporating all corrections reported by him and other additional corrections, reads as follows:
$$ \frac{p_{2} – p_{DS,2}}{p_{1} – p_{DS,1}} = \frac{1 + \frac{y_{1}}{1 – y_{1}} \frac{M_{W}H_ {1}}{\varrho_{w,1}R_{m}T_{1}}}{\frac{M_{W}H_{1}}{\varrho_{w,1}R_ {m}T_{2}} \left[ \frac{1 + 3\alpha(T_{2} – T_{1})}{1 – y_{1}} – \frac{\varrho_{w,1}}{\varrho_{w,2}} \right] + \frac{H_ {1}}{H_{2}}} \quad (27) $$
In this expression, the volume fraction y 2 is fully incorporated according to Eq. 17, so that only known, given, or calculable quantities appear on the right side of Eq. 27.
7.5 Explicit Equation for Pressure
By foregoing the incorporation of Eq. 17, but with the help of introducing the term fₕ, which yields y₂, p₂ results as follows:
$$p_2 = p_{DS,2} + (p_1 – p_{DS,1}) \frac{V_1}{V_2} \frac{T_2}{T_1} \frac{y_1}{y_2} f_H \quad (28)$$
The term fₕ should be interpreted as the compression factor of solubility.
$$f_{H} = \frac{1 + \frac{1 – y_1}{y_1} \frac{\rho_{w,2} R_m T_1}{M_W} \frac{1}{H_1}}{1 + \frac{1 – y_2}{y_2} \frac{\rho_{w,2} R_m T_2} {M_W} \frac{1}{H_2}} \quad (29)$$
Furthermore, all ratios of volume expansion, temperature increase, and headspace volume fraction isolated by rearrangement are replaced by their corresponding compression factors. By suitable rearrangement, the following equation is obtained:
$$P_2 = P_{DS,2} + (P_1 – P_{DS,1}) \frac{V_1}{V_2} \frac{T_2}{T_1} \frac{y_1}{y_2} f_H \quad (30)$$
It should be noted that this equation yields identical values to Beck’s Eq. 27. The advantage of Eq. 30 is that the compression mechanisms can be expressed dimensionlessly using their compression factors, which will be explained in the next section.
8 Quantification of Influences
8.1 Compression Factors
The compression factors derived so far, Eq. 1, Eq. 3, Eq. 4, and Eq. 29, can now be combined into a dimensionless total compression factor f ges.
$$ f_{\text{ges}} = f_{\alpha} f_{T} f_{y} f_{H} $$
The pressure equation 30 then further simplifies to:
$$ p_2 = p_{DS,2} + (p_1 – p_{DS,1}) f_{\text{ges}} $$
$$ = p_{DS,2} + p_{L,1} f_{\text{ges}} $$
The final pressure p₂ in the container increases up to the saturation vapor pressure pDS,₂ at the final temperature Z₂ plus the partial pressure pL,₁ of air in the headspace at initial temperature multiplied by the total compression factor fges.
8.2 Influence of Container Thermal Expansion
Using the compression factor f V from Eq. 3, we can describe the influence of the container’s thermal expansion on pressure as the ratio of volumes in state 1 to state 2. From T₂ > T₁ it follows that V₁ /V₂ < 1, meaning the container’s thermal expansion has a pressure-relieving effect. This effect is highly dependent on the choice of container material. In Fig. 1, fα is plotted as a function of temperature for glass and high-density polyethylene (HD-PE). Assuming a linear expansion coefficient of α = 5 · 10⁻⁶ 1/K for glass and α = 159 · 10⁻⁶ 1/K for HD-PE, the compression factor is f ↵ = 0.995 and fα = 0.955, respectively. Glass containers behave almost like rigid bodies, while HD-PE containers experience an expansion of almost 5%.
8.3 Influence of Heating
The second compression factor fₜ results from the ratio of absolute temperatures before and after the state change (see Eq. 4). If the filling temperature is 20°C, fₜ = 1.34 is obtained. Heating alone causes a pressure increase of approximately 35%. This value for other filling temperatures, relative to a sterilization temperature of 121°C, can be taken from Fig. 2.
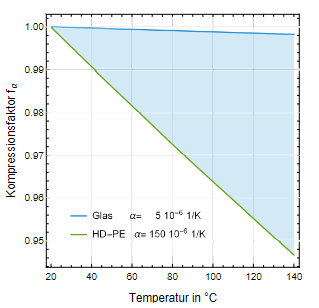
Fig. 1: Pressure relief due to container expansion
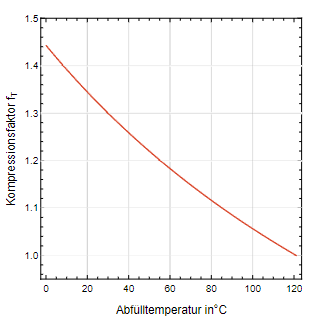
Fig. 2: Compression factor fₜ as a function of filling temperature
8.4 Influence of Headspace
The third factor fy (see Eq. 1) represents the reduction of the headspace and is the most influential. Fig. 3 illustrates the reduction of the headspace volume fraction y as a function of temperature. For glass, it can be seen that an initial headspace fraction of 10% is compressed to approximately 5% upon reaching the sterilization temperature. Accordingly, the compression factor f y = 2.1 (Fig. 4), meaning the internal pressure doubles. If the volume fraction
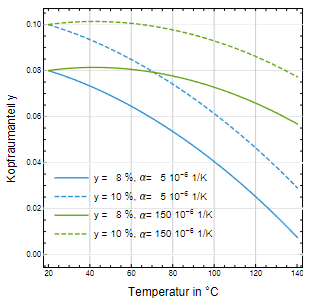
of the headspace is reduced to 8%, the compression factor increases to f y = 2.9, meaning the internal pressure triples. In contrast, if HD-PE is considered as the container material, the pressure increase is significantly lower (see Figs. 3 and 4).
8.5 Influence of Air Solubility
Fig. 5 shows the factor fₕ as a function of temperature. Again, a headspace fraction of 8% or 10% is assumed as an example. Initially, the air dissolved in the water is still expelled, causing a slight pressure increase with a maximum at approximately 40°C. If the temperature rises above 60°C, the partial pressure of the air becomes so high that the air is driven back into the water, thereby causing pressure relief in the container.
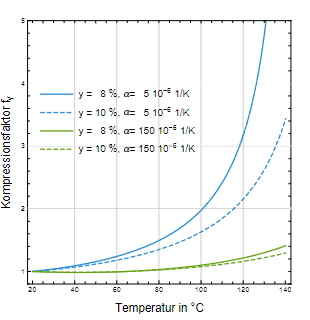
Fig. 4: Compression factor of headspace volume fraction fy
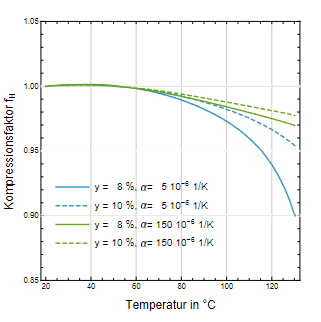
Fig. 5: Compression factor of air solubility in water
However, the overall influence on pressure is small, as shown by the comparison with and without gas solubility for a headspace fraction of 8% or 10% in Fig. 6.
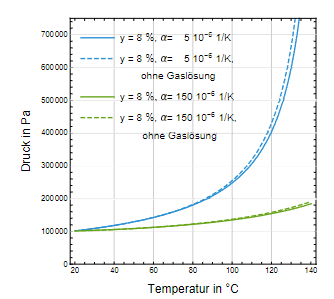
Fig. 6: Pressure relief as a result of air solubility in water
However, the question arises whether the air is actually dissolved during the relatively short heating phase, i.e., whether thermodynamic equilibrium is reached, as assumed by Eq. 29. For large-volume containers, e.g., X-ray contrast media in bottles, there is a certain distance between the outer surface and the core of the liquid due to heat conduction. The temperature gradient results in convective movement of the liquid, which frequently renews the boundary to the gas phase and promotes the diffusion of air into the liquid phase. For small-volume containers, e.g., injection solutions in pre-filled syringes, the temperature gradient is smaller and the resulting convection is correspondingly weaker. Therefore, a slower dissolution process of the air is to be expected, meaning equilibrium is reached with a delay.
8.6 The Support Pressure
The pressure in the container is now determined considering the presented pressure mechanisms. Fig. 7 shows the absolute pressure in the container as a function of temperature for glass and HD-PE. Again, a headspace volume fraction of 8% was assumed, both with and without considering the solubility of air in water. If the container is made of glass, with an 8% headspace, an internal pressure of approximately 4.2 bar is present at 121°C without considering gas solubility, and 4.0 bar with considering solubility. Support pressure for glass container without gas solubility
$$ p_{\text{st}}(y_1 = 0.08) = p_2 – p_{DS}(121\,\textdegree\mathrm{C}) $$
$$ = 4.2 – 2.0 = 2.2\,\text{bar} $$
Support pressure for glass container with gas solubility
$$ p_{\text{st}}(y_1 = 0.08) = p_2 – p_{DS}(121\,\textdegree\mathrm{C}) $$
$$ = 4.0 – 2.0 = 2.0\,\text{bar} $$
The difference between the two cases is only 0.2 bar. Due to the uncertainty of equilibrium establishment regarding gas solubility during the heating phase, the larger value of p 2 = 4.2 bar should be considered when determining the support pressure. For HD-PE, however, a support pressure of approximately 0.6 bar would be sufficient (Fig. 7), with gas solubility playing hardly any role due to the low pressure.
Fig. 8 illustrates this using the total compression factor as a function of temperature and headspace fraction. The temperature range was chosen from 115°C to 125°C, and the headspace was varied between 6% and 10%. It is clearly visible that the total compression factor for glass assumes enormous values with a small headspace. The associated pressure increase will highly likely lead to bursting of the containers or displacement of syringe stoppers. Based on the significantly flatter surface for HD-PE, it becomes clear that by a suitable choice of the headspace fraction, the pressure increase during sterilization can be well controlled. Finally, using Figure 9, it is possible to select the appropriate combination of support pressure and headspace volume fraction for the presented materials, glass and HD-PE.
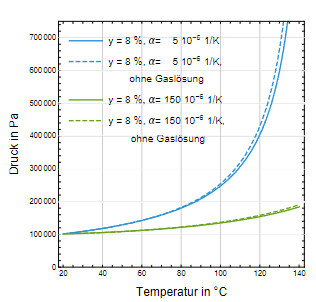
Fig. 7: Pressure profile during sterilization with 8% headspace volume fraction, with and without gas dissolution for glass and HD-PE
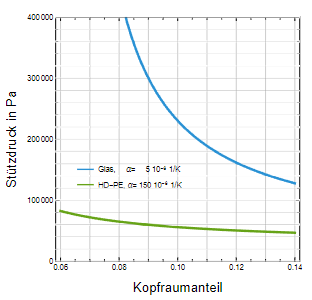
Fig. 9: Support pressure as a function of headspace volume fraction for glass and HD-PE
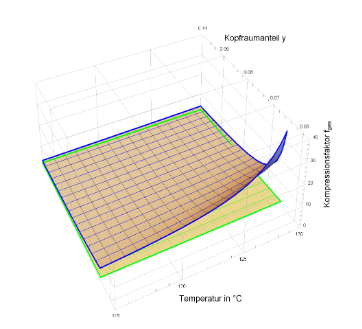
Fig. 8: Total compression factor for glass (blue grid) and HD-PE (green)
9 Summary
The pressure increase in closed containers during heat sterilization can be abstracted into four temperature-dependent compression factors, where the order reflects the strength of the influence:
- fy Choice of headspace fraction
- fₜ State change due to heating
- fα Volume change of the container
- fₕ Solubility of air in water
The compression factors fy and f T form the basis for selecting process parameters. The temperature difference during filling and sterilization is crucial. The smaller this difference, the smaller the pressure difference between the inside of the container and the sterilization chamber. If the support pressure becomes too high computationally due to technical constraints, the headspace must be increased. The same applies to preventing stopper movement. Adjusting the headspace fraction is therefore the technically simplest solution.
The compression factor fα makes it possible to consider the material of the primary packaging. In the context of drug development, the primary packaging can thus be chosen in favor of materials with high thermal expansion coefficients, provided they do not interact with the drug components. The length changes of the container cause pressure relief in the container during sterilization and are to be preferred. If glass containers are required, the process must be designed based on the factors mentioned above.
The compression factor fₕ fundamentally shows that pressure relief occurs because the increasing partial pressure of air causes more air to dissolve in the water. However, this diffusion process is time-dependent, so the thermodynamic equilibrium assumed for the calculations is only a rough approximation. It is more probable that this equilibrium is not reached during the sterilization process. Coupled with the fact that this influence is quantitatively negligible compared to the other compression factors, it should be disregarded for predominantly aqueous solutions.
In practice, the required support pressure will be calculated based on the temperatures in the individual process phases, such as preheating, sterilization, and cooling, and the sterilizer will be parameterized accordingly. Containers with fixed closures, such as bottles and vials, are insensitive to stepwise changes in support pressure in sequential process phases. For containers with movable closures, such as pre-filled syringes, the regulation of the support pressure should be made as continuously dependent as possible on the internal temperature of the containers, i.e., for aqueous solutions, the resulting pressure of the saturated vapor curve. Based on the calculations presented here, it has been shown that sufficient parameters are available to implement a sterilization cycle for closed containers of aqueous solutions in practice with an appropriately equipped sterilizer.
References
1
Revised Release on the IAPWS Industrial Formulation 1997 for the Thermodynamic Properties of Water and Steam. The International Association for the Properties of Water and Steam, Lucerne, 2007
2
BAUER, Kurt H. ; FRÖMMING, Karl-Heinz ; FÜHRER, Claus: Pharmaceutical Technology. 5th ed. Georg Thieme Verlag, Stuttgart, 1997
3
BECK, Robert E.: Autoclaving of Solutions in Sealed Containers: Theoretical Pressure-Temperature Relationships, Pharmaceutical Manufacturing. (June 1985), pp.:18–23; Erratum in September 1985 issue, p. 12
4
BRYANT, Peter L.: Modeling of Parenteral Container Headspace Pressure. In: Technical Note in PDA Journal of Pharmaceutical Science &Technology 52 (May-June 1998), No. 3, pp. 123–128
5
DORSEY, Ernest N. ; 1957, February (Ed.): Properties of Ordinary Water Substance in all its Phases: Water-Vapor, Water, and all the Ices. N.Y. : Reinhold Publishing Corporation (3rd Printing)
6
IUPAC: Iupac Handbook 1996-97. International Union of Pure Applied Chemistry, Portland, Or., 1997
7
JOYCE, Martin A. ; LORENZ, Jeffrey W.: Internal Pressure of Sealed Containers During Autoclaving. In: Journal of Parenteral Science and Technology 44 (November-December 1990), No. 6, pp. 320–323
8
NATIONAL INSTITUTE OF STANDARDS AND TECHNOLOGY, U.S. Department of Commerce: https://physics.nist.gov/cuu/ Constants/index.html.– Accessed : 2019-12-12
9
PHYSICAL-TECHNICAL FEDERAL INSTITUTE (PTB): PTB Material Data Sheets, SDB 11: Water. January 1995
10
VENTURA, Dominic A. ; SHEAFFER, George E.: Unique Aspects of Steam Sterilization Validation of Disposable Syringe Components. In: Journal of Parenteral Science and Technology (November-December 1984), pp. 121–214
11
VOIGT, Rudolf: Pharmaceutical Technology. 9th ed. Deutscher Apothekerverlag, Stuttgart, 2000
12
ZIMMERMANN, Ingfried: Pharmaceutical Technology. Springer Verlag, Berlin, 1998