

Particle Deposition in Sampling Systems
1 Introduction
Determining the cleanliness class requires the determination of the particle concentration. Using specially shaped probes, air is drawn from the cleanroom and conveyed to the detector of a particle counter via tubing. Measurement uncertainty is influenced by factors such as the detection limit of the particle counter, the differentiation of particles into size classes, the calibration accuracy regarding these size classes, the background noise during signal processing due to electromagnetic radiation, the flow conditions during sampling, and the transport of the aerosol to the sensor [2]. ISO 21501-4:2007 [11] therefore regulates the requirements for particle counters, while ISO 14644-1:2015 [1] defines the procedure for classifying air cleanliness.
Deposition effects occur during the suction and transport of the aerosol sample, which causes the measured particle concentration to be lower than the actual concentration. As early as 1992, Federal Standard 209E (Appendix B40.2) [6] contained instructions on isokinetic sampling and the residence time in sampling tubes (<10 s). Since the last update of the ISO 14644-1:2015 [1] standard, a specific length specification can now be found in Appendix C.4.1.2:
For sampling of particles larger than and equal to 1 µm, the transit tube length should not exceed the manufacturer’s recommended length and diameter, and will typically be no longer than 1 m in length.
Monitoring to provide evidence of cleanroom performance regarding air cleanliness based on particle concentration is regulated by ISO 14644-2:2015 [10]. Appendix A.4 refers to the effectiveness of sampling, and includes the following note:
The use of long sample transport tubes as required by multiplexing manifold systems is inappropriate for monitoring particle sizes ≥ 5 µm.
For the fixed installation of monitoring systems, distances of several meters are bridged, and elbows and couplings are frequently used. Furthermore, various tube and pipe diameters between 1/8″ and 3/4″ are in use. These parameters have an influence on the transport of the sample to the particle counter. The purpose of this report is to quantitatively estimate the sampling error in cleanliness class determination using mobile and fixed particle counters. For this purpose, calculation models from the literature are used. The deposition effects are first examined individually and then combined. To make a direct comparison with the definition of cleanliness classes according to ISO 14644-1:2015 [1], the cumulative representation of the distribution function is introduced. Subsequently, a normalized representation of the cumulative penetration rate is presented, and the sampling error is calculated for several examples.
2 Deposition Effects
2.1 Penetration Rate
The review article by Brockmann [4] mentions several mechanisms for the deposition of particles:
1. Force fields
a) Gravitation
b) Inertia/Acceleration
- in straight pipes
- in elbows
- at cross-sectional changes
c) Electric fields
2. Concentration differences
- a) Diffusion through Brownian molecular motion
- b) Thermophoresis
- c) Diffusiophoresis
Of these, the following deposition effects are considered here:
- 1. Inertia in straight pipes
- 2. Inertia in elbows
- 3. Inertia at cross-sectional changes
- 4. Diffusion through Brownian molecular motion
A complete derivation of the calculation equations is omitted here. These can be found in the following publications: Baron and Willeke [3], Brockmann [4], Friedlander [7], Hinds [9], Liu and Agarwal [12], Pui et al. [13], Vauck and Müller [14], Willeke and Baron [15], Ye and Pui [16]. For high deposition rates, the penetration rate P (pass through, penetration) is often used. This clearly illustrates which particles pass through a separator [5]. In German technical literature, the term is also used in connection with sampling [8]. Deposition and penetration rates are linked as follows.
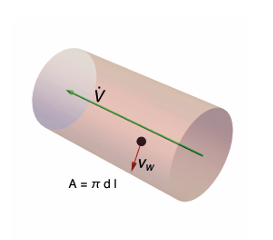
Fig. 1: Transport velocity to the wall
the term is also used in connection with sampling [8]. Deposition and penetration rates are linked as follows.

The dimensionless deposition rate ε (effective removal, efficiency) was derived by the cited authors either with the help of a transport velocity vwall in the direction of the tube wall with the area A = πdl from the gas volume flow ˙ V (Fig. 1) or determined empirically from experimental data.
2.2 Diffusion
In the range of very small particles, the assumption of gas continuity must be rejected. Gas molecules constantly collide with each other. They can only move undisturbed along the free path for a certain time. The gas molecules, in turn, collide randomly with the dispersed particles. The resulting particle movement corresponds to Brownian motion. The relative velocity between the gas and the particle surface is non-zero, so the so-called Cunningham correction is included in the calculation of the diffusion coefficient.
Mass transport is expressed using a dimensionless parameter, the Sherwood number Sh, which is characterized by the flow conditions and gas properties. The Sherwood number is calculated as a function of the Reynolds and Schmidt numbers.
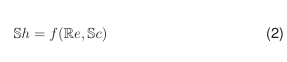
With the help of the diffusion coefficient D, the inner diameter di, and the Sherwood number Sh, the transport velocity vdiff is determined.

This gives the penetration rate in a pipe of length l and pipe flow velocity u as follows:
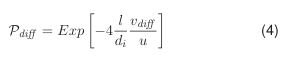
Since practically all particle counters operate with a constant volume flow of 28.3 l/min, the flow velocity u
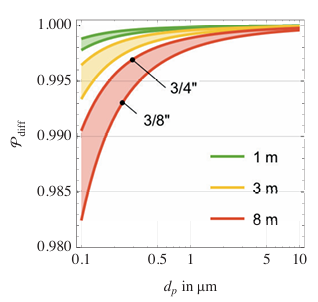
Fig. 2: Penetration rate for diffusion
depends only on the selected tube diameter, and the following considerations regarding deposition in the tube can be applied to most commercially available particle counters. ISO 14644-1:2015 [1] recommends a tube length of less than or equal to 1 m. The Lasair III (PMS) device was selected as an example of a particle counter. The scope of delivery includes a tube with a diameter of 3/8″ and a length of 3 m. According to the operating instructions, the use of tubes up to 8 meters in length with inner diameters of 3/8″, 1/2″, and 3/4″ is permissible. Fig. 2 shows the calculated diffusion penetration rate for the three mentioned tube lengths, each for the smallest and largest permissible tube diameter.
As expected, more particles are deposited the longer the tube is. Likewise, deposition decreases with increasing inner diameter. The combination of the smallest diameter with the greatest length causes a sampling error at 0.5 µm of at most 0.4%. According to ISO 21501-4:2007 [11], ± 5% is permissible as measurement uncertainty for the flow rate (volume flow) of particle counters, i.e., 5% more or fewer particles reach the sensor and distort the result accordingly. Thus, the sampling error due to diffusion can be classified as comparatively insignificant.
2.3 Turbulent Flow in Straight Pipes
In a turbulent flow, particles collide more frequently and are driven in the direction of the less turbulent flow. Particles with high inertia can penetrate the laminar boundary layer all the way to the wall and are deposited there. The transport velocity to the wall vtube is formulated using the Reynolds number Re, the Stokes number Stk, and the velocity u of the gas in the tube as follows:

The penetration rate resulting from deposition due to turbulent motion in straight tubes can thus be calculated as follows:
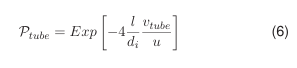
Fig. 3 shows the calculated penetration rate for various tube diameters and tube lengths. At a diameter of 3/8″, deposition for particles of size 5.0 µm of up to 20% can be observed, i.e., this deposition effect must not be neglected.
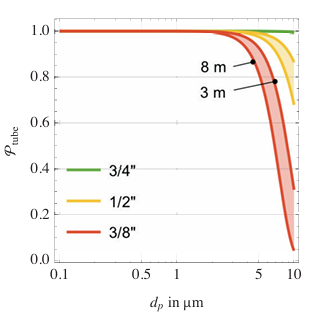
Fig. 3: Penetration rate for turbulent flow
2.4 Pipe Elbows
In pipe elbows, deposition due to inertia depends on the geometry of the elbow (radius and angle) as well as the interactions of the particles with the dispersing gas and the gas with the pipe wall. Based on experimental data, Pui et al. [13] determined a correlation in which the penetration rate depends on the Stokes number Stk and the bend angle φ, but not on the Reynolds number or the bend radius. Validity is limited to applications where the bend radius is at least four times larger than the inner diameter of the pipe (rB/di > 4). The empirical equation for the penetration rate of elbows is given by the above-mentioned authors as follows:
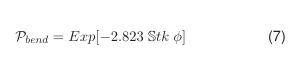
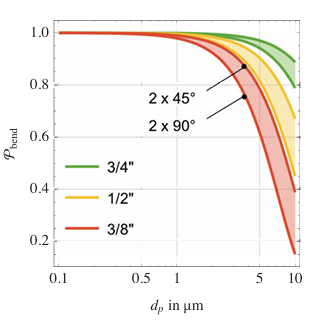
Fig. 4: Penetration rate as a result of deposition in elbows
Fig. 4 shows the penetration rate for various tube diameters and two elbows. The boundaries of the ranges are marked by the curvature of the elbows (45° or 90°). Even with large tube diameters (shown in green), the deposition for particle size 5.0 µm is still approx. 5%. The penetration rate drops by up to 40% for a tube length of 8 m and a diameter of 3/8″ (shown in red). The deposition effect due to elbows therefore has a very large influence on sampling.
2.5 Cross-Sectional Changes
Changes in the cross-section cause a short-term change in the flow direction. Turbulence occurs in the gas flow, meaning the particles can only follow the flow to a limited extent and are partially deposited. The reverse case of diameter expansion, like contraction, leads to a pressure loss; however, the particles can now move more freely and deposition is negligible. Brockmann [4] provides an empirically determined correlation for deposition at cross-sectional changes, which includes the diameters before (d1) and after (d2) the contraction. The dimensionless quantities cx and w were derived by the author from experimental data.
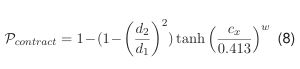
Fig. 5 shows the penetration rate for various combinations of cross-sections. In the case of a change starting from a large diameter (3/4″), significant deposition only begins from approx. 15 µm. All curves show a deposition of at least 20 µm. 20 %. At approx. 50 µm, cross-sectional changes cause a reduction in the penetration rate of 50% to 80% with an increasing contraction ratio. A similar picture emerges when the initial diameter is reduced to 1/2″. However, the deposition at 10 µm is already 20%.
If one starts with the smallest diameter of 3/8″ and goes to 1/4″, noticeable deposition begins at approx. 4 µm and is already 40% at 10 µm. This deposition effect should be taken into account when reducing the diameter to 1/4″.
3 Combination of Deposition Effects
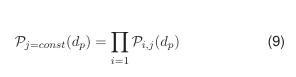
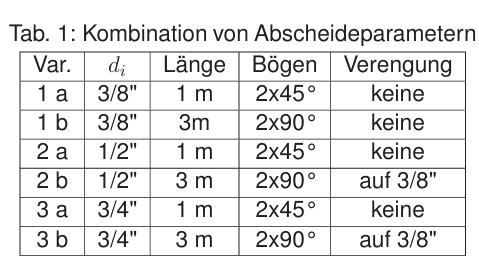
The penetration rates in a tube section can be understood as probabilities that a particle of a certain size can pass through the pipe. In the sense of an AND operation, these probabilities are multiplied together. The total penetration in a tube section with index j for i deposition effects is as follows:
If only one specific deposition effect is considered, the probability of passage through all j tube sections is also obtained by multiplication.
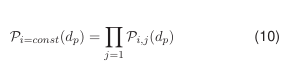
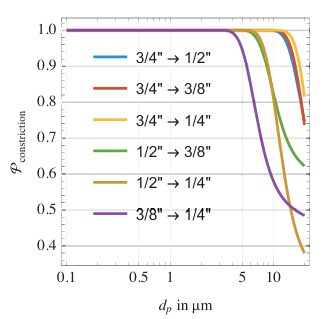
Fig. 5: Reduced penetration rate caused by cross-sectional contractions
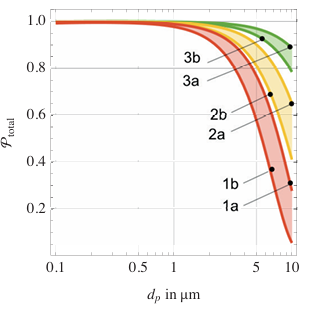
Fig. 6: Total penetration rate for the parameter combinations according to Table 1
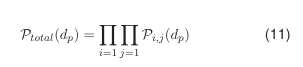
Table 1 lists installation combinations for various tube diameters, specifically for the installation of two elbows, different tube lengths, and a cross-sectional contraction. Figure 6 shows the corresponding results. The boundaries of the ranges are marked by the curvature of the elbow of 45° with a tube length of 1 m and the curvature of 90° with a length of 3 m and a contraction to 3/8 inch. As expected, parameter combination 1b leads to the worst and 3a to the best total penetration rate.
4 Cumulative Consideration
A cleanliness class is defined such that the number of all particles that are greater than or equal to a defined particle size must not be exceeded.
A cleanliness class is defined such that the number of all particles that are greater than or equal to a defined particle size must not be exceeded. A power distribution has become established as a simple approximation of this cumulative frequency distribution. The ISO 14644-1:2015 [1] standard specifies this with Equation 12. In this, N means the ISO class and dp the particle size in µm.
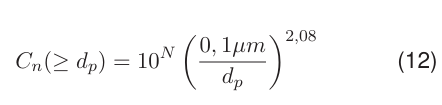
It should be noted that the distribution function of an aerosol is defined in statistics such that it applies to all particles smaller than a certain particle size. Both definitions are linked according to Equation 13.
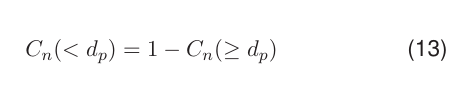
Thus, the distribution function of a cleanliness class is obtained from the transformation of Equation 12.

The penetration rate has so far been specified here for particles of a certain particle size. If the frequency density of the particles in the aerosol to be tested is known, the numerical reduction of the particles can be calculated from the multiplication of the relative frequency (distribution density at dp) and the penetration rate for each particle size dp. These values cannot yet be compared with a cleanliness class. For this, the distribution function C(<dp) of the aerosol in the cleanroom is required. Assuming that the aerosol in the room exactly fulfills the definition of a certain cleanliness class, Equation 14 can be used for the calculation. The distribution density c(dp) is then obtained by taking the first derivative with respect to dp.
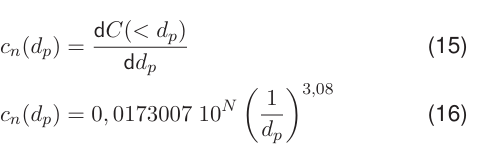
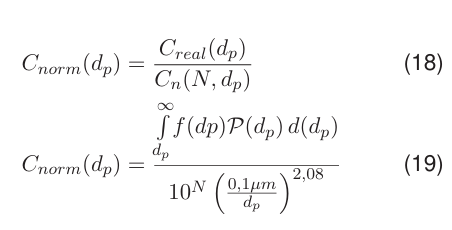
Now the distribution density of a particle size d p can be multiplied by the penetration rate at this size. Subsequently, the value of the distribution function C real (<dp) is calculated by integration from zero to less than the particle size. If the integration limits are swapped from the particle size to infinity (see Equation 17), the detour of back-calculation via Equation 13 is avoided. This yields a continuous curve of the real cumulative frequency distribution Creal (≥dp), which can be directly compared with the cleanliness class.
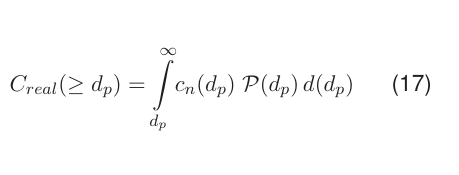
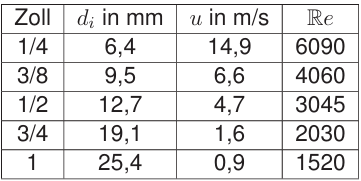
Table 2: Deviation from the cleanliness class for various tube diameters and Reynolds numbers.
The calculated real distribution is no longer represented as a straight line in the double logarithmic network, as is the case for the cleanliness class definition. The curve deviates from the cleanliness class with increasing particle size. The curve distorted in this way lies below the cleanliness class to be determined. This means that an erroneous measurement suggests a better cleanliness class than is actually present.
The curve should first be calculated according to ISO 14644 for a tube length of 1 m. No tube diameter is specified in ISO 14644-1, so the calculation was carried out for the usual five diameters. Table 2 shows the tube diameters in inches (column 1) and millimeters (column 2). Since the volume flow is constant, different flow velocities prevail (column 3), from which the corresponding Reynolds numbers result (column 4).
The results for ISO 8 are shown in Fig. 7. It is striking that at Reynolds numbers below 3045, deposition is negligible for practical purposes in the range of 0.5 to 5.0 µm. In fluid mechanics, the limit of Re = 2330 applies to the transition from linear to turbulent flow. Apparently, the transition to turbulent flow is a similar point of orientation for the manifestation of particle deposition effects during sampling.
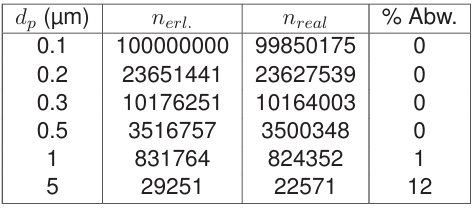
Fig. 8 shows the situation for ISO classes 5 to 8. The percentage deviations between the defined cleanliness class and the real measured one are the same for all ISO classes. Therefore, it is sufficient to estimate the quantification of the sampling error based on ISO class 8. Table 3 lists the expected and real determined particle numbers for a straight tube with a length of 1 m and a diameter of 3/8″. The sampling error for particles greater than or equal to 5 µm is still approx. 12%.
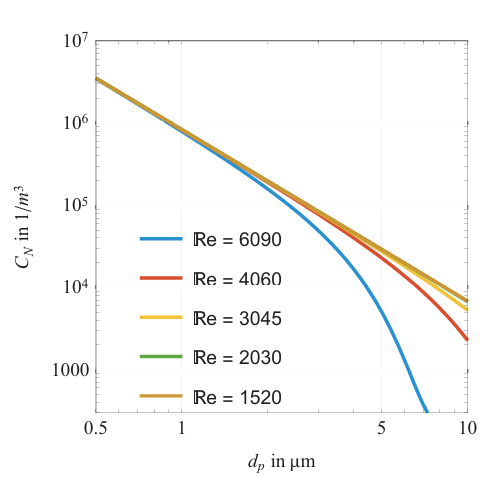
Fig. 7: Real cleanliness class ISO 8 at various Reynolds numbers and tube length 1 m without elbows and cross-sectional contractions
Table 4 is intended to illustrate how the sampling error increases when the inner diameter is reduced to 1/4″. A reduction of particles greater than or equal to 1.0 µm by approx. 5% and for particles greater than or equal to 5.0 µm by approx. 83% occurs. Regarding particle size 5.0 µm, the particle number concentration is measured as nearly one class “better.”
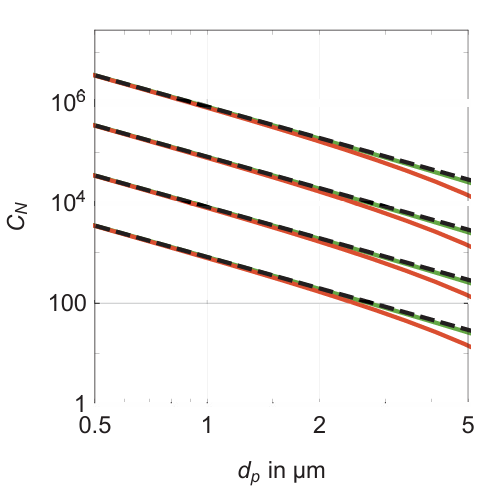
Fig. 8: Real cleanliness class ISO 5 to 8
Table 3: Required class limits and calculated particle numbers for ISO class 8 with tube length 1 m and inner diameter 3/8″
5 Normalized Representation of the Sampling Error
In the previous section, it was shown which real cumulative distribution results from deposition in the tube. However, the percentage quantification always had to be determined by specific calculations for the individual particle sizes. By forming the quotient of the real and cumulative distribution, a normalized representation of the sampling error is obtained directly.
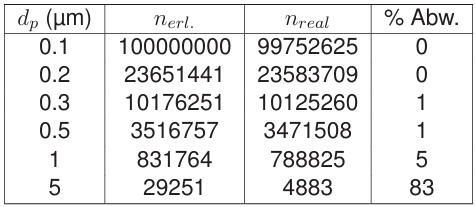
Table 4: Required class limits and calculated particle numbers for ISO class 8 with tube length 1 m and inner diameter 1/4″
The variants shown in Figure 9 were calculated using the parameter combinations from Table 1. By comparing Figures 6 and 9, the advantage of the normalized cumulative representation can be seen. Instead of only seeing a reduction in the penetration rate, the sampling error of the system under consideration can now be read directly in percent for all particle sizes.
6 Example Calculations
ISO 14644-2:2015-12 [10] defines the design of monitoring systems. Section A.4.2 requires that the sampling efficiency for the selected particle sizes must be estimated. Long transport paths are described as unsuitable, particularly for particles ≥5.0 µm. Elbows and tube diameters are not explicitly mentioned, but are implied in Section B.3.2.3.
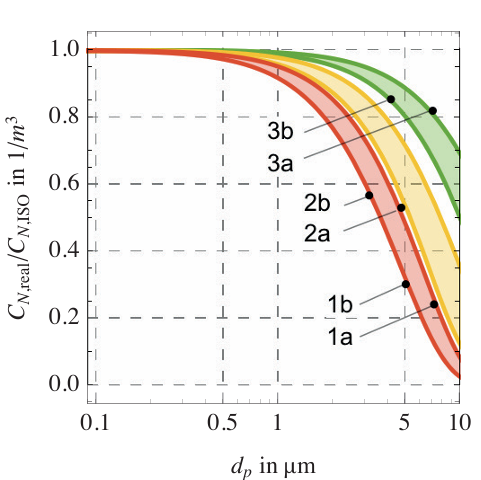
Fig. 9: Normalized, cumulative representation of the sampling error with the parameters from Table 1
If particle numbers occur that are significantly below the expected limits for the monitored cleanliness class, an investigation should be carried out according to ISO 14644-2. The cause could lie, among other things, in the sampling system. This can be checked using the method presented here. The following configurations of monitoring systems are to be evaluated as examples:
- A) a long tube of 30 m, diameter 3/4″ with six 90° elbows to a remote particle counter
- B) a long tube of 10 m, diameter 1/2″ with three 90° elbows to a particle counter in the adjacent room
- C) a short tube of 0.5 m, diameter 3/8″ with two slight 15° deflections due to tube offset between probe and particle counter in the same room
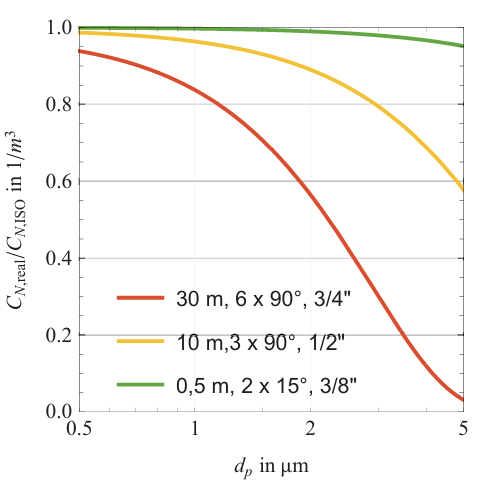
Fig. 10: Normalized, cumulative representation of the sampling error for three selected monitoring systems
In Fig. 10, it can be clearly seen that configuration A, despite the inner diameter of 3/4″, leads to a significant sampling error for particles greater than or equal to 5.0 µm of approx. 95%. In configuration B, a smaller inner diameter of 1/2″ was chosen for installation, and the number of elbows was halved through optimized routing. The sampling error here is still approx. 40%. Configuration C is characterized by a short tube and small bend angles. The sampling error is reduced to an acceptable value of approx. 5%. Regarding particle size greater than or equal to 0.5 µm, the sampling error for all configurations is at most approx. 5%, which is less than or equal to the tolerance of the volume flow of particle counters allowed by ISO 21501-4:2007-05 [11].
7 Summary
The reduction of the penetration rate in sampling tubes as a result of diffusion, turbulent motion, inertia in elbows, and cross-sectional contractions was shown. Turbulent motion and inertia in elbows mainly contribute to deposition. The penetration rate is reduced in common systems for particle sizes from 1 µm. However, for particles greater than or equal to 5.0 µm, a sampling error must always be expected.
Through the cumulative calculation of the penetration rate, a direct comparison could be made between the distribution function according to the cleanliness class definition and the distribution function actually to be expected due to particle deposition. The curves of the cleanliness class definition are increasingly distorted with increasing particle size, resulting in a false-positive determination of the cleanliness class. With an unfavorable choice of sampling system, the error regarding particle size 5.0 µm can be in the order of magnitude of a cleanliness class.
In its last update in 2015, ISO 14644-1 provides specific information on the length of tubes permissible during sampling. It was shown here that the determination of the cleanliness class for particles greater than or equal to 5.0 µm is always error-prone if tubes are used. The sampling error can be reduced by choosing a small distance between the sampling probe and the particle counter and a large inner diameter for the tube. The best choice consists of a sampling probe that is placed directly on the particle counter without a tube.
Since the deposition of particles in tubes depends heavily on the flow conditions, the mere specification of a tube length is not sufficient. For a reliable design, the degree of turbulence should therefore be determined and controlled using the Reynolds number. Currently, ISO 14644-2 only provides vague information on the installation of monitoring systems. It does not explicitly address routing with regard to avoiding elbows and cross-sectional contractions. Based on the present calculations, however, it can be derived that particle counters should ideally be used directly at the sampling location with a connected probe. Should the use of tubes be unavoidable, especially when monitoring particles ≥5.0 µm, the alarm limits must be corrected downwards according to the reduction in the penetration rate. The calculation of the normalized cumulative penetration rate significantly simplifies the design of the sampling system. Using the normalized diagram, the sampling error can be read directly for every particle size and for any cleanliness class.
References
1
ISO 14644-1:2015-1 Cleanrooms and associated controlled environments- Part 1: Classification of air cleanliness by particle concentration
2
BARON, P.A.; WILLEKE, K: Factors Affecting Aerosol Measurement Quality. In: BARON, A. (Ed.): Aerosol Measurement Principles, Techniques, and Applications. New York: Van Nostrand Reinhold, 1993, Ch. 8, pp. 23–40
3
BARON, P.A.; WILLEKE, K: Gas and Particle Motion. In: WILLEKE, P.A. (Ed.): Aerosol Measurement- Principles, Techniques, and Applications. New York: Van Nostrand Reinhold, 1993, Ch. 3, pp. 23–40
4
BROCKMANN, J. E.: Sampling and Transport of Aerosols. In: WILLEKE, P.A. (Ed.): Aerosol Measurement- Principles, Techniques, and Applications. New York: Van Nostrand Reinhold, 1993, Ch. 6, pp. 77–111
5
DIALER, K; ONKEN, U; LESCHONSKI, K.: Grundzüge der Verfahrenstechnik und Reaktionstechnik. 1st ed. Munich: Carl Hanser Verlag, 1984
6
FED-STD-209E: Airborne Particulate Cleanliness Classes In Cleanrooms and Clean Zones. 1992
7
FRIEDLANDER, Sheldon K.: Smoke, Dust, and Haze- Fundamentals of Aerosol Dynamics. New York: Oxford University Press, 2000
8
GAIL, L.; GOMMEL, U.; HORTIG, H.-P.: Reinraumtechnik. 3rd ed. Heidelberg: Springer, 2012
9
HINDS, W. C.: Aerosol Technology Properties, Behavior, and Measurement of Airborne Particles. 1st ed. New York: John Wiley & Sons, 1982
10
ISO 14644-2:2015-12: Cleanrooms and associated controlled environments- Part 2: Monitoring to provide evidence of cleanroom performance related to air cleanliness by particle concentration
11
ISO 21501-4:2007-05: Determination of particle size distribution- Single particle light interaction methods- Part 4: Light scattering airborne particle counter for clean spaces
12
LIU, B.Y.H.; AGARWAL, J. K.: Experimental observation of aerosol deposition in turbulent flow. In: J. Aerosol Sci. 5 (1974), pp. 144–55
13
PUI, D. Y. H.; F, Romay-Novas; LIU, B. Y. H.: Experimental study of particle deposition in bends of circular cross section. In: Aerosol Sci. Technol. 7 (1987), pp. 301–15
14
VAUCK, R.A.; MÜLLER, H. A.: Grundoperationen chemischer Verfahrenstechnik. Leipzig: Deutscher Verlag für Grundstoffindustrie, 1992
15
WILLEKE, K (Ed.); BARON, P. A. (Ed.): Aerosol Measurement- Principles, Techniques, and Applications. New York: Van Nostrand Reinhold, 1993
16
YE, Y; PUI, D. Y. H.: Particle deposition in a tube with an abrupt contraction. In: J. Aerosol Sci. 21 (1990), No. 1, pp. 29–40