
Air Change Rate, Cleanliness Class, and Clean-Up Period in Cleanrooms with Turbulent Mixed Flow
1 Introduction
1.1 Subject Matter
On September 21, 2005, the EMEA Inspections Group published a working paper [8] that presents several proposed changes to the currently valid supplementary Guideline 1, commonly known as Annex 1 [7], for discussion. The four-page working paper was only posted on the EMEA server on November 23, 2005, with several explanatory notes, and the EMEA is providing the opportunity to comment on the proposed amendments until April 30, 2006. In light of this current development, we would like to discuss some of these proposed changes, which center around the concepts of air change rates, cleanliness grades, and the clean-up period.
1.2 Objective
The objective of this report is to analyze the term “clean-up period.” This term is directly related to the air change rate and the flushing of Grade B, C, and D cleanrooms. Only these cleanrooms, which are equipped with turbulent mixed flow ventilation systems, are subject to the regulatory requirement to demonstrate the clean-up period. The procedure for demonstrating the clean-up period is described as the so-called recovery test in Section B.12 of ISO 14644-3 [12]. This outlines the second objective of this article: the explanation and application of the recovery test.
1.3 Purpose
In terms of timing, the demonstration of the clean-up period is provided during the operational and performance qualification (OQ/PQ) shortly before the start of production operations. However, the design of the HVAC system is already decided during the design stage. Therefore, if one wishes to avoid unpleasant surprises during the demonstration of the clean-up period, it is necessary to carefully plan for the subsequent fulfillment of this important regulatory requirement as early as the design stage. The purpose of this article is to point out this important circumstance.
2 Overview of Annex 1
2.1 Annex 1: May/September 2003
The first supplementary guideline for the manufacture of sterile medicinal products, hereinafter referred to as Annex 1, has been revised several times since its original version [1] from 1989 (entered into force: January 1992). The latest revision by the Ad Hoc GMP Inspectors Group was adopted by the Pharmaceutical Committee in May 2003 and entered into force in September 2003 [7].
It consists of 20 unnumbered chapters, the headings of which are highlighted by a larger font type: PRINCIPLE, GENERAL through QUALITY CONTROL. The chapters are mostly divided into several sections. These sections have been numbered from 1 to 93 and are referred to as either section or clause, which are marked with a section symbol (§) in this article for clear identification. In accordance with the objective, we are considering section § 3 and specifically the following notes (Notes) that were added to the table of the cleanliness classification
:
- Note (b): regarding the short clean-up period of 15-20 minutes
- Note (c): regarding the number of air changes in Grade B, C, and D areas
2.2 Proposals: September 2005
The proposals for amendment can be summarized as follows:
- Sections § 3 and § 4 in General are to be replaced by 7 new sections: § 3 to § 9, again under the General chapter. This increase by 5 additional sections arises primarily because the previous 6 notes [Notes (a) to (f)] to the cleanliness classification table are being dissolved and will no longer appear as such for this table, but will be written as separate sections.
- Sections § 42 and § 52 in Processing are to be changed in content and will then form the new sections § 47 and § 57, again under the Processing chapter.
- Section § 88 in Sterile Products is to be changed in content and will then form the new section § 93, again under the Sterile Products chapter.
- After all changes, the newly numbered sections § 1 to § 98 will be created.
2.3 Subdivision of Clean Areas
As is well known, the production of sterile preparations must be carried out in clean areas. These Annex 1 areas should be separated from other production areas (non-Annex 1 areas) by ensuring that personnel access and the introduction of equipment and materials take place through airlocks: § 1 in Annex 1.
According to the principle of separated zones, Annex 1 areas are divided into a critical core area (Grade A area in a Grade B environment) and controlled auxiliary areas (Grade C/D areas) (§ 2: separate areas within the clean area). Therefore, 4 different cleanliness classes are distinguished, each with its own requirements, especially regarding ventilation concepts.
2.4 Unidirectional Air Flow
The requirements for Grade A areas are generally only met by laminar air flow systems. The inventor of the laminar air flow principle, Willis WHITFIELD, introduced this term himself in 1962 and simultaneously identified it as inaccurate because it is not a laminar flow in the sense of fluid mechanics. He proposed the correct term “uni-directional air flow,” which was then adopted much later in FED STD-209-E and ISO standard 14644.
However, the term “laminar air flow” is so deeply anchored in the technical language of cleanroom technology that both terms are used side by side in Annex 1 (see § 3, explanations for Grade A). In German, the term “turbulenzarme Verdrängungsströmung” (TAV for short) is used, which from a fluid mechanics perspective is even a more precise term for the American “uni-directional air flow,” see VDI 2083-2 [13].
2.5 Non-Unidirectional Air Flow
The second basic concept of cleanroom technology is the “non-unidirectional air flow” system, referred to here as turbulent mixed flow (TMS for short). This system is characterized by the fact that air flows into the room from one or more supply air outlets, usually equipped with HEPA filters (first air), and dilutes the existing contamination.
The requirements for Grade B, C, and D areas consist of maintaining a specific air change rate or a specific clean-up period. The EC Guide initially tacitly assumes that these areas are equipped with a turbulent mixed or dilution system (TMS). In the first 4 versions of the EC Guide, more than 20 air changes per hour were required. This requirement was frequently criticized because it meant high investment and operating costs for pharmaceutical companies [16].
Since the revision of Annex 1 in 1997, the fixed requirement for a 20-fold air change rate was abandoned and replaced by a formalized recommendation that requires the design of the air change rate to be dependent on room size, room equipment, and the number of persons. In addition, there was a clarification of the term “short clean-up period,” which was set at a guidance value of 15 to 20 minutes.
3 Regulatory Requirements
3.1 Annex 1 (September 2003), § 3, Note (b)
3.1.1 Original English Text
The particulate conditions given in the table for the ”at rest” state should be achieved after a short ”clean up” period of 15-20 minutes (guidance value) in an unmanned state after completion of operations.
3.1.2 Translation
The limit values for the particle number concentration specified in the table for the at-rest state must be reached again after a short clean-up period of 15-20 minutes (guidance value), specifically without the presence of persons and after completion of all operational activities.
3.2 Proposals, September 2005, § 7
3.2.1 Original English Text
The particle limits given in the table for the ”at rest” state should be achieved after a short ”clean up” period of 15-20 minutes (guidance value) in an unmanned state after completion of operations.
3.2.2 Notes
Note (b) is to be replaced by a separate section § 7. The content regarding the clean-up period has remained the same except for one clarification: “particulate conditions” is to become “particle limits.”
3.3 Annex 1 (September 2003), § 3, Note (c)
3.3.1 Original English Text
First part of the sentence: In order to reach the B, C and D air grades, the number of air changes should be related to the size of the room and the equipment and personnel present in the room.
Second part of the sentence: The air system should be provided with appropriate terminal filters such as HEPA for grades A, B and C.
3.3.2 Translation
First part of the sentence: In order to achieve air purity in Grade B, C, and D rooms, the number of air changes must be related to the size of the room and the equipment present in the room or the number of persons present in the room.
Second part of the sentence: The ventilation system in Grade A, B, and C cleanrooms should be equipped with suitable terminal filters such as HEPA filters.
3.4 Proposals, September 2005
In the proposed amendments, the passage regarding the number of air changes and the equipment with HEPA filters is to be deleted.
3.5 Remarks
In the first version of Annex 1, the equipment with HEPA filters for cleanliness grades A, B, C, and D and a more than 20-fold air change rate for cleanliness grades B, C, and D were mandated. At least in this respect, full alignment with the FDA’s Aseptic Guide was achieved. These requirements still apply to the FDA today, see Section IV Buildings and Facilities in [9], whereas in Annex 1 they have been gradually broadened or generalized with each revision, and according to the Proposals, there will soon be no requirement at all regarding air change frequency and equipment with HEPA filters.
According to the state of the art and technical rules, one can of course dispense with an explicit requirement for the use of HEPA filters in cleanrooms, as otherwise the fulfillment of the purity grade would not be possible. Likewise, one can dispense with the specification of a certain air change frequency in cleanrooms if a specific clean-up period is prescribed. This will be shown in the following sections.
4 Air Change and Recovery Time
4.1 Max von PETTENKOFER
The term air change was first coined by Max von PETTENKOFER1 in an essay [15] from 1886. He established the hygienic requirement that living spaces should be ventilated. The entire room air should be exchanged for fresh air once per hour. This was intended to expel human exhalations (and those of chamber pots!) from the dwelling, as well as exhaust gases, vapors, and odors caused by wood firing, cooking, and washing. PETTENKOFER, who was actually a chemist, showed that CO2 emissions by humans themselves and by their method of energy production were harmful in unventilated rooms and elevated the CO2 content of the room air to the benchmark for ventilation frequency. This CO2 benchmark was incorporated into the VDI ventilation rules, which later remained valid as DIN 1946 until the 1980s.
4.2 Terminology
The concept of air change has changed over the years. “Fresh air change” became “outdoor air change” because the term fresh air suggests an air quality that outdoor air (e.g., in cities) does not possess.
For clarification, the term “room air change” was introduced, as the air exchange refers to the air content of the room. In modern HVAC systems, the room air change is no longer effected by pure outdoor air, but by a mixture of outdoor air and recirculated room air (called recirculated air). This mixture is then called supply air, so that today we speak of a supply-room air change. In special cases, this supply air can consist of pure outdoor air. We refer to this as an outdoor-room air change. As a rule, however, we speak of supply air that contains only a small proportion of outdoor air (make-up air), just enough to cover unavoidable room leakage, process exhaust air volumes, and certain hygienic requirements (outdoor air rate).
4.3 Supply-Room Air Change
The terms used in today’s regulations, such as frequency of air change (EC Guide) or Air Changes per Hour (FDA Aseptic Guide), should be understood as hourly supply-room air change:
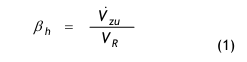
where Vzu represents the supply air volume flow in m³/h actively supplied to a room and VR the volume of the empty room in m³. The hourly supply-room air change βh is thus a volume-specific flow quantity with the unit 1/h.
As a rule, cleanrooms will have several supply air outlets. The total volume flow supplied to the room consists of the sum of the volume flows of all supply air outlets:
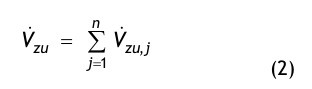
where n = number of supply air outlets.
The addition “actively supplied” should be understood as the direct room feed of supply air from an HVAC system. Leakage air flows that can flow into the room under consideration from adjacent rooms due to room pressure differences, for example via door gaps, should not be attributed to the supply-room air change. These leakage air flows could be contaminated and would thus not contribute to dilution.
4.4 Ventilation Effectiveness
The supply-room air change is an initial measure of room flushing. Due to the velocity at which it enters the room from the outlets, the supply air possesses a momentum large enough to set a room flow in motion and maintain it. In this way, the air highly purified by the HEPA filters, also called first air, mixes with the room air contaminated by the process and persons, thus effecting a dilution of the contamination. As described above, this ventilation principle is called turbulent mixing flow.
The degree of flushing or ventilation efficiency is a further measure of how well the room air is mixed with the first air and thus how the contamination is diluted. Ventilation efficiency, or ventilation effectiveness, is defined by the following equation:
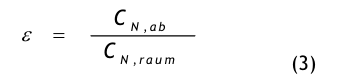
where CN,ab denotes the mean particle number concentration in the exhaust air and CN,raum the mean particle number concentration in the room air. With ideal mixing, ε = 1 and the quality of the room air and the exhaust air are equal. With non-ideal mixing, CN,raum > CN,ab and ε < 1.
One wonders how quality differences in the room air and exhaust air can develop at all, since it is the “same” air. Stagnation zones form in the room, i.e., large-volume stationary rotational flows of the room air in which contamination can accumulate, see Fig. (1).
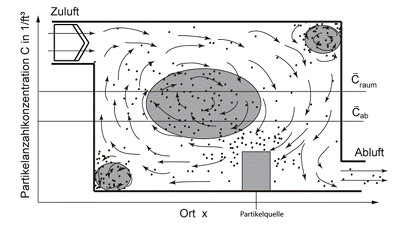
Fig. 1: Schematic representation of ventilation efficiency
Local concentration differences arise in the room because the first air does not enter the stagnation zones. However, as soon as the room air flows into the exhaust air duct, it is intensively mixed due to the turbulent duct flow. Because the portions of “unused” first air are now intensively mixed with the contaminated room air, the particle number concentration in the exhaust air duct drops compared to that which prevails in the room as a volume average. This flushing effect was discovered in the late 1940s [14] and continues to be investigated today within the framework of Indoor Air Quality.
As stated above: only the supply air can effect this dilution. The exhaust air, on the other hand, exerts only a minor influence on the room flow. This is due to the fact that the intake velocity drops to zero at a very short distance in front of the exhaust air inlets. Figuratively speaking: you can blow out a candle, but you cannot “suck” it out. In this sense, the exhaust air only acts passively on the room flow. Through a clever arrangement of the exhaust air inlets, stagnation zones in the room can be sucked empty, i.e., the exhaust air acts to some extent as boundary layer suction.
5 Recovery Function
5.1 Balance Equation
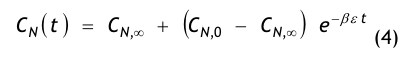
From a room-side particle flow balance, i.e., a balance of all aerosol particles flowing into and out of the room, one obtains the recovery function, also called the decay function or recovery time equation:
The quantities used in the model equation have the following meaning:
- CN(t) = the particle concentration present in the room at time t,
- CN,0 = the initial concentration, i.e., the particle concentration present in the room at time t = 0,
- CN,∞= the final concentration, i.e., the particle concentration present in the room after a very long flushing time (t → ∞), the so-called stationary final value or at-rest value,
- t = the time in minutes (min),
- β = the air change in 1/min, derived from the hourly air change βh:
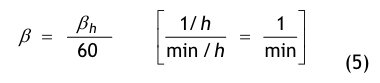
- ε = a dimensionless quantity describing the degree of flushing or ventilation efficiency/effectiveness according to the explanations for Eq. (3) above.
The quantity CN here generally stands for the mean particle number concentration in the room, where we understand the mean value as the volume average. The term particle number concentration, sometimes also called number density, refers to the number of aerosol particles dispersed in a control volume. Since the number has no dimension, the unit of number concentration is 1/m³ or 1/ft³. More precisely, we should speak of a cumulative particle number concentration (frequency sum), because we consider all aerosol particles whose particle size Dp is equal to or
greater than a considered particle size D*p. Frequently, D*p = 0.5 µm is chosen as the considered particle size, so that we speak of a cumulative particle number concentration with Dp ≥ 0.5 µm.
5.2 Representation
In Fig. (2), the recovery function is shown as an example for a Grade B room in a semi-logarithmic plot. The particle number concentration CN(t) in 1/m³ is plotted on the y-axis. Because the range of values for the number concentration can span several decades, the y-axis is divided logarithmically. Time t in minutes is plotted on the x-axis. This axis is divided linearly.
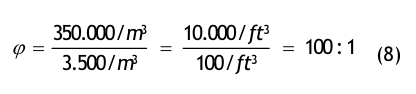
The curve of the recovery function begins at time t = 0 with the initial value CN,0; in the example, CN,0 = 350,000 /m³ was chosen. The curve initially drops steeply and then transitions with uniform curvature into the stationary value CN,∞. After a very long, theoretically infinitely long time t→ ∞, the stationary final value CN∞, = 1,750 1/m³ is reached.
According to the definition of the clean-up period, the value CN,0 is to be considered as the limit value of the particle number concentration in the room for the “in operation” state:

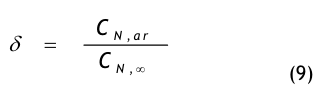
(After about 20 min, the value of the particle concentration has dropped to CN,ar = 3,500 1/m³. We refer to the quantity CN,ar as the mean particle concentration in the room in the “at rest” state. The dilution factor shall be denoted by φ and defined as follows:
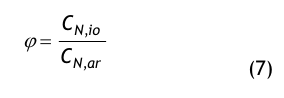
In the specific case chosen, the dilution factor is:
The time that elapses to drop from the particle concentration in operation (CN,io) to the particle concentration at rest (CN,ar) is called the clean-up period. This quantity shall generally be denoted by tφ, in this specific case by t0.01. This designation was chosen in ISO 14644-3. For the at-rest state to be achievable in this time period, the stationary value CN,∞ must lie below the value of CN,ar. This driving concentration difference CN,ar – CN,∞ shall be defined with the help of the drive factor δ:
Eq. (4) is rearranged as follows:
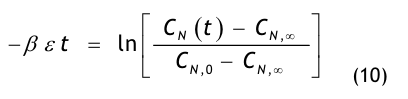
The concentration quantities are replaced using Eqs. (7) and (9):
- The concentration at time t = tφ is: CN(tφ ) = CN,ar.
- The initial concentration at time t = 0 is: CN,0 = CN,io = φCN,ar.
- The final concentration at time t →∞ is: CN,∞ = CN,ar /δ .
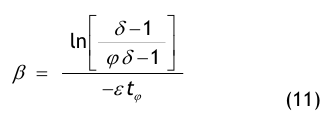
We now insert these quantities into Eq. (10) and obtain a design criterion important for the layout of room ventilation:
Example:
We would like to determine the required air change β for a Grade B room under the condition that the regulatory value φ = 100 for the dilution factor is maintained and the clean-up period fulfills the minimum value of tφ ≤ 20 min. From the machine layout, a ventilation efficiency of ε = 0.75 was estimated. The residual contamination was estimated using the filter concept, the quality of the outdoor air aerosol, and the internal particle sources at CN,∞ ≅ 50/ft³ (≥ 0.5 µm), i.e., δ = 100/50 = 2. Thus, the following air change is required:
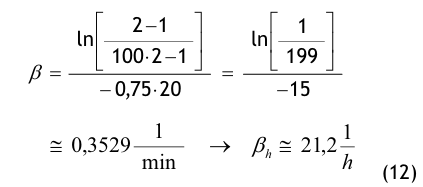
If we succeed in improving the ventilation efficiency by choosing suitable supply air outlets so that the degree of flushing increases to ε > 0.8, then a 20-fold hourly air change would also be sufficient to fulfill the regulatory requirements, see Fig. (6).
5.3 Normalization
The recovery function can be normalized as follows:
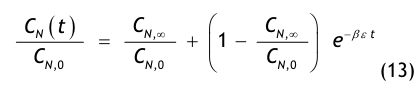
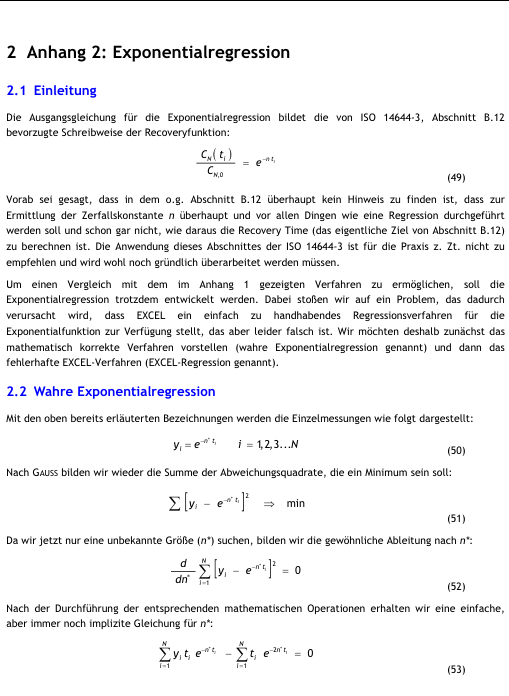
This normalization forms the starting equation for a regression procedure used to determine the unknown quantities CN∞ and n = β ε from the values of the recovery time measurement. In the procedure according to ISO 14644-3, Section B.12, CN∞ is usually neglected, and a regression is performed only with respect to the decay constant n = β ε according to the following equation:
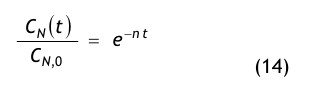
This neglect (CN,∞ ≈ 0) leads in many cases to an overestimation of the clean-up period tφ and thus to a misinterpretation of the actual clean-up behavior of the room, as will be explained in more detail in the following example.
5.4 Explanation
The expression on the left side of Eq. (13) is the dimensionless normalized particle number concentration, because this quantity has the value 1 in the initial state, the so-called mathematical norm. On the right side of Eq. (13) is an exponential function whose exponent contains the product of the quantities β and ε in addition to time t. This makes it immediately clear that the decrease in the mean particle number concentration in the cleanroom over time depends on both the supply-room air change and the ventilation efficiency. Poor flushing of the room must therefore be compensated for by a higher air change.
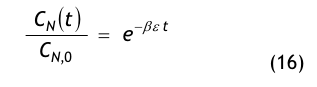
If terminal HEPA filters are used, the particle number concentration will drop to a value near zero after a very long flushing time, i.e.:

Only then can the decay function be simplified as in Eq. (14):
6 Example
6.1 Method
Verification of the clean-up period is performed using recovery time measurement. The usual procedure is to first artificially increase the cumulative particle number concentration in the room. With the HVAC system running, an aerosol stream is sprayed into the room for a short time using a particle generator. After a certain distribution time, the particle number concentration in the room has leveled off and decayed to such an extent that we can switch on the particle counter and begin the measurement.
This distribution time is necessary to reach the so-called quasi-stationary state and to allow the initial concentration to drop to a level suitable for the particle counter. We measure the respective concentration CN(ti) at certain points in time ti:

Enough measured values i = 1, 2, 3, · , N should be collected so that a suitable statistical evaluation can be performed, e.g., the Gaussian regression method of minimizing the sum of squared deviations (least squares approximation). For this purpose, it is useful to normalize the measured values:
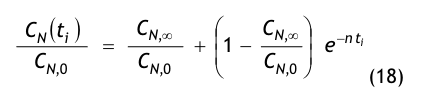
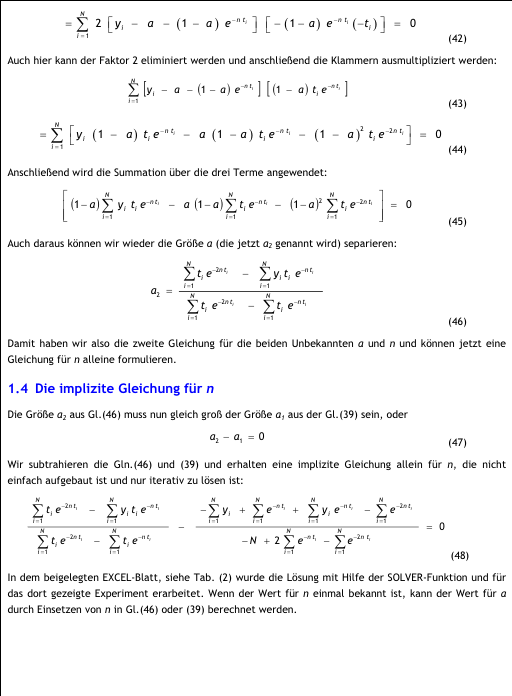
From the regression, the sought quantities CN,∞ / CN,0 and n = β ε can then be determined. The details of the regression procedure are presented in Annex 1.
6.2 Result
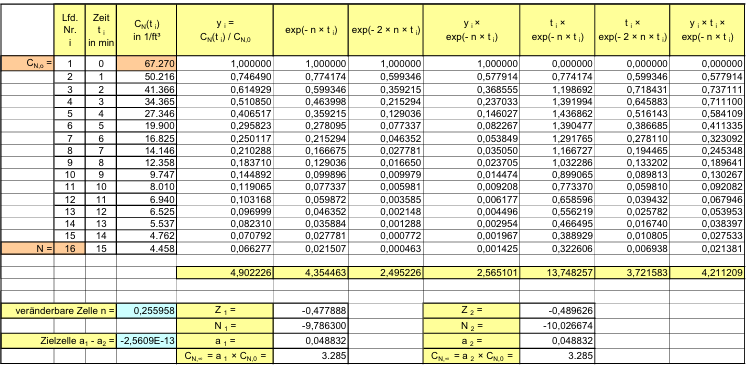
Table (2) summarizes the measured values of a recovery time measurement in an Excel table. Measurements were taken in a Grade C room with an approx. 20-fold hourly air change with the aim of verifying the clean-up period for a 100:1 dilution. The initial value was approx. 70,000/ft³, i.e., significantly below the coincidence error of the optical particle counter. After 16 minutes, the measurement was aborted when it became apparent from the values on the printer strip that the particle number concentration was no longer far from the stationary final value and that following the further drop in values would not have yielded any additional information.
The measured values obtained in this way were subjected to a full regression, and the regression curve could be drawn using the calculated regression constants,

see Fig. (3). It can be seen that the measured values group very well around the regression curve. Fig. (3) also shows that a 100:1 dilution was not achieved, because we would then have had to expose the particle counter to concentrations above 300,000/ft³. Verification of the clean-up period must be done purely by calculation from here on:
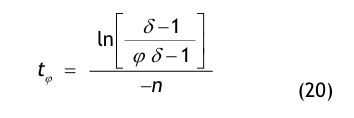
To calculate tφ, the drive factor δ is required, which is obtained from the measurement or from the regression:
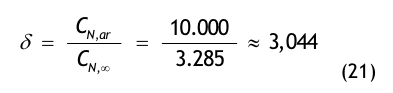
Thus we obtain:
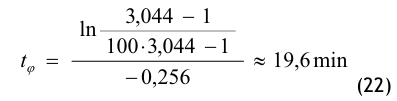
i.e., the specified clean-up period is maintained. A graphical illustration of the evaluation after full regression is shown in Fig. (5).
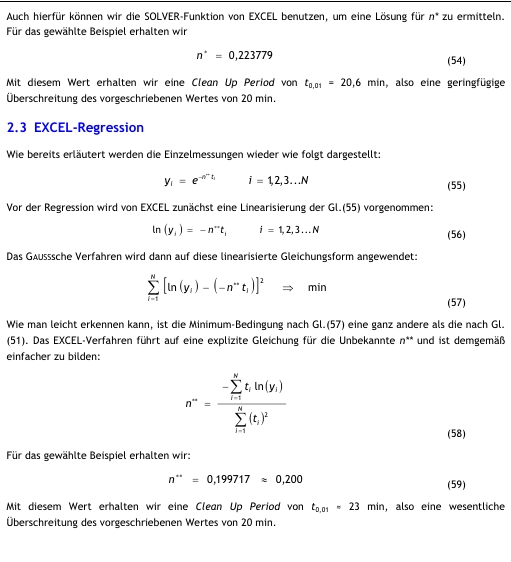
According to the ISO method, i.e., neglecting the stationary final value, we obtain n** = 0.200 or tφ = 23 min with the EXCEL regression and n* = 0.224 or tφ = 20.6 min with the true exponential regression. In both cases, the specified clean-up period is exceeded; one must add: only apparently, because the ISO method is in most cases not suitable for determining the clean-up period from the measured values of a recovery time measurement.
7 Summary
7.1 Regulatory Text
For rooms of grades B, C, and D, Annex 1 requires compliance with a clean-up period of 15 … 20 min. This requirement is adopted almost verbatim in the Proposals for Amendment, and thus no change in regulatory intent is sought.
However, the clean-up period becomes a prominent quality feature because all further requirements regarding both compliance with a specific air change frequency and the use of terminal HEPA filters are to be deleted without replacement. Therefore, the feature requirements should be defined particularly clearly and unambiguously. This is where our criticism of the wording in Annex 1 as well as in the proposals begins.
From the cryptic text of § 3, Note (b) or the new § 7, one can read that the clean-up period for Grade B rooms should refer to a 100:1 dilution, and for Grade C rooms to a 10:1 dilution. In the table of purity grades, the limit values of the particle number concentration for the at-rest and in-operation states are clearly named, so that the dilution factors can be derived therefrom = φ CN,io / CN,ar.
For Grade D rooms, these limit values for the in-operation state are missing, i.e., we do not actually know on which dilution factor the clean-up period should be based. Nevertheless, the new § 8 also requires compliance with the recommended clean-up period for Grade D rooms.
We therefore recommend setting the clean-up period for purity grade D to a value of 20 min with a dilution factor of φ = 2:1.
7.2 Recovery Test
Annex 1 contains no explicit requirements for a verification method for the clean-up period. Therefore, it is obvious to refer to the ISO standards, specifically to Section B.12, Recovery Test, in ISO 14644-3.
In technical literature, the term recovery time is used synonymously with clean-up period from regulatory usage. The dilution effect of the ventilation system for cleanrooms with turbulent mixing flow is represented with the help of the so-called recovery function:

Brief contamination of the cleanroom leads to an increase in the particle number concentration to the value CN,0, which is reduced back to the at-rest value CN,∞ after a certain time due to the dilution effect. This decontamination occurs exponentially with time t. The rate of reduction or recovery rate depends on the decay constant n = β ε, i.e., the product of air change β and ventilation efficiency ε.
To ensure that the at-rest purity grade (CN,ar) is safely reached within the required recovery time, the stationary final value of the particle number concentration in the room (CN,∞) must be significantly below CN,ar. This was characterized by the so-called drive factor δ = CN,ar / CN,∞. The value of CN,∞ is determined by internal particle sources (persons, equipment, active substances and excipients, process sequences), by the chosen filter concept, and by the number concentration and particle size distribution of the outdoor air aerosol. The estimation methods required for this are known.
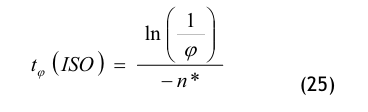
The evaluation of the recovery time measurement should be carried out according to the shown procedure of full regression (least squares approximation), especially if it is not possible to measure through two decades of particle number concentration. From the full regression, we obtain the sought quantities CN,∞ (and thus also δ) and n. The recovery time is then determined purely by calculation:
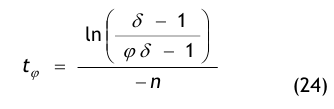
An evaluation according to the ISO method, i.e., neglecting CN,∞ ≈ 0, leads to a decay constant n*, which is generally smaller than that from the full regression: n* < n. This also makes the recovery time longer:
In many cases, the clean-up period is exceeded. Once this is documented within the scope of qualification, significant corrective measures must inevitably be initiated, which are actually superfluous.
Theses
For more than 15 years, we at Dohm Pharmaceutical Engineering have been following the continuous changes in cGMP requirements, primarily from the regulatory authorities in Europe (EMEA) and the USA (FDA). In advising our pharmaceutical clients, we see daily the difficult boundary conditions that arise in the implementation and fulfillment of these requirements. As a service provider for the pharmaceutical industry, we not only want to point out these boundary conditions but specifically offer solutions for them. Therefore, we participate in the discussion on the current proposals for amendment to Annex 1 in the form of objections or through this present elaboration, the results of which we briefly summarize in the following theses.
Thesis 1:
In Grade B cleanrooms according to Annex 1, in which a clean-up time tφ≤ 20 min over two decades (φ = 100:1) must be verified, the required supply-room air changes (βh) are at values ≥ 20/h, as one can generally assume ventilation efficiencies between 0.75 and 0.9.
Thesis 2:
In Grade C cleanrooms, the required supply-room air change (βh) when using HEPA filters can certainly be < 20/h, as here only a clean-up time tφ ≤ 20 min over one decade (φ = 10:1) must be verified, see Fig. (7).
ATTENTION: For FDA-regulated production areas (Supporting Clean Area Class 100,000), a supply-room air change of βh≥ 20/h must still be verified.
Thesis 3:
The guidance value for recovery times of 15 to 20 min, as still specified by Annex 1, should be changed to “≤ 20 min.” Describing a guidance value as “from … to” leads to confusion. It suggests that recovery times of < 15 min might not be accepted.
Our proposed text for the new Annex 1 is therefore:
» The limits for particle number concentration specified in the table for the at-rest state must be reached again after a short clean-up phase of a maximum of 20 minutes (guidance value), in the absence of personnel and after completion of all operations. «
Thesis 4:
For Grade D cleanrooms, the limit value for the in-operation concentration has not been specified in Annex 1. As a result, the dilution factor φ cannot be determined.
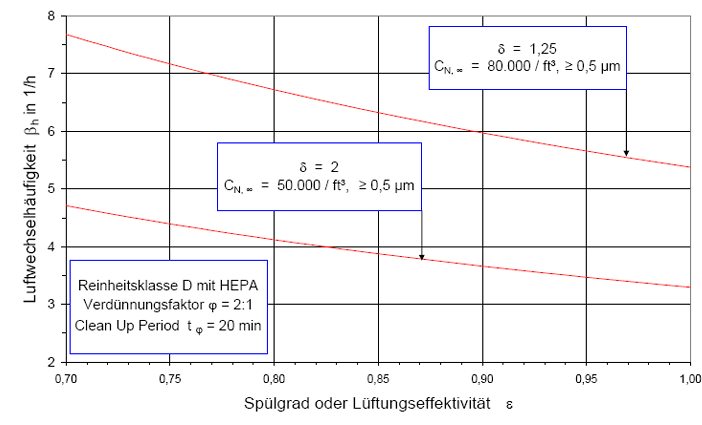
We recommend setting the dilution factor to φ = 2:1, unless other pharmaceutical or technological boundary conditions of the manufacturing process exist. It follows that the particle number concentrations in operation assume the following values:
- for particles ≥ 0.5 μm CN,io = 200,000 /ft³ or 7,000,000 /m³,
- for particles ≥ 5.0 μm CN,io = 1,400 /ft³ or 40,000 /m³.
Thesis 5:
We recommend that HEPA filters also be used in Grade D cleanrooms.
A study by ZIEMER and SCHENDERLEIN [17, 18] has shown that outdoor air filtration only with fine dust filters of grades F7 and F9 without the use of terminal HEPA filters is not sufficient to guarantee a purity grade of D at rest in the long term. The stationary final value of the room concentration CN,∞ depends significantly on the planning: filter concept, concentration and particle size distribution of the outdoor air aerosol, outdoor air proportion, particle flow and particle size distribution of internal sources.
Thesis 6:
The supply-room air change in Grade D cleanrooms should be at least 8/h to 10/h using terminal HEPA filters, see Fig. (8).
Thesis 7:
With the help of the above-mentioned design criteria for air change and the associated recovery time, airlock systems can also be designed as single-chamber airlocks instead of multi-chamber airlocks. In this case, the air change, ventilation efficiency, and recovery time after a defined load (gowning procedure, etc.) must be validated in such a way that proof is provided for the same purity grade of the airlock compared to the cleanroom.
Authors

Dipl.-Ing. (TU) Thomas RAATZ studied process engineering at the TU Dresden and has been active in the pharmaceutical industry in the field of qualification of cleanroom systems for more than 12 years, the last 6 years of which as a project manager at Dohm Pharmaceutical Engineering.

Dr.-Ing. Wolf ZIEMER studied energy and
process engineering at the TU Berlin and received his
doctorate from the TU Budapest on the subject of aerosol filtration.
He has been active in the field of
cleanroom technology and pharmaceutical process
engineering for 25 years, the last 6 years of which at
Dohm Pharmaceutical Engineering.
Tables
Table 1
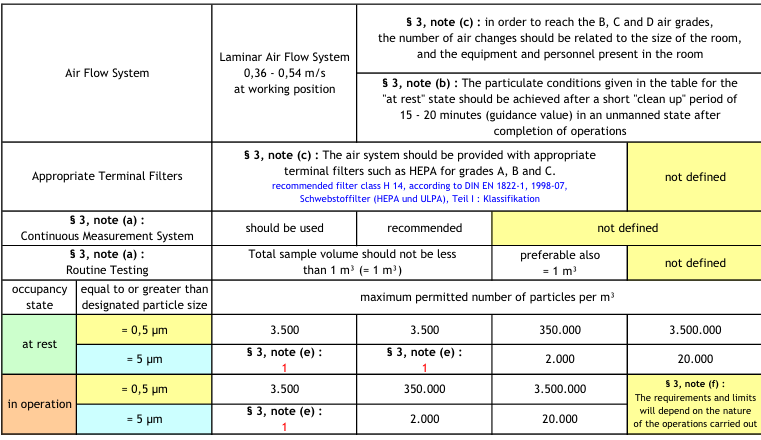
Table 2
Overview of the Full Regression
Figures
Figure 2 Clean-up Period for a Grade B Room
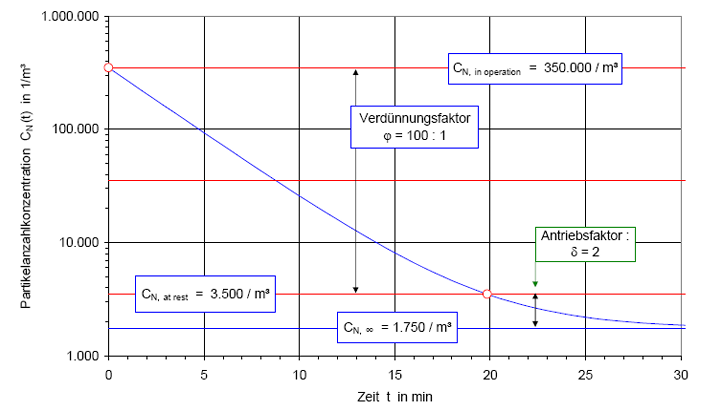
Figure 3 Example Experimental Values & Regression Curve
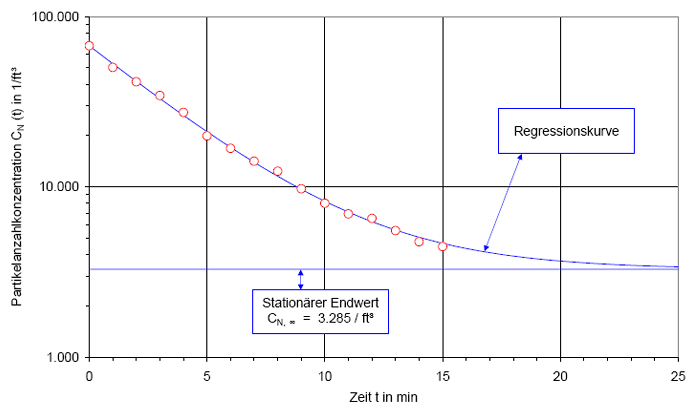
Figure 4 Example Comparison of EXCEL Regression and True Exponential Regression
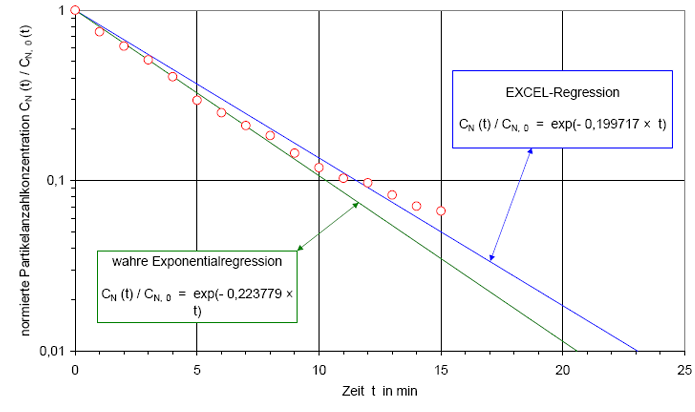
Figure 5 Example Full Regression
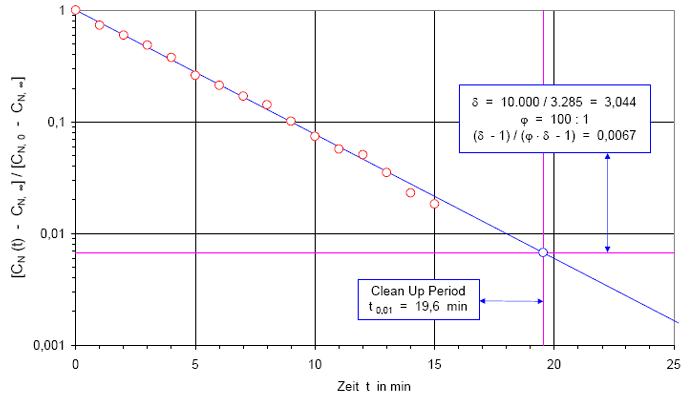
Figure 6 Air Change for Grade B Rooms with HEPA Filters
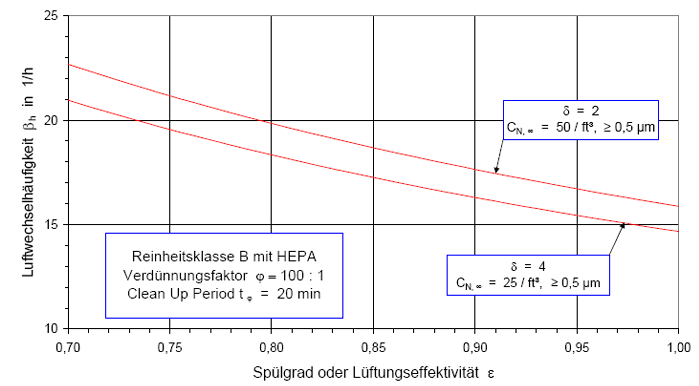
Figure 7 Air Change for Grade C Rooms with HEPA Filters
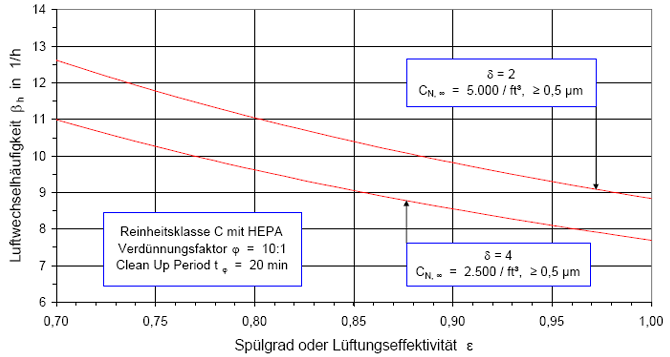
Figure 8 Air Change for Grade D Rooms with HEPA Filters
Appendices
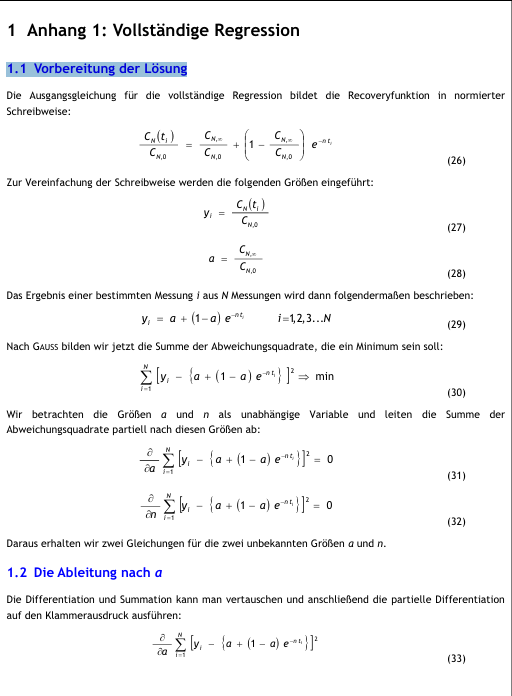
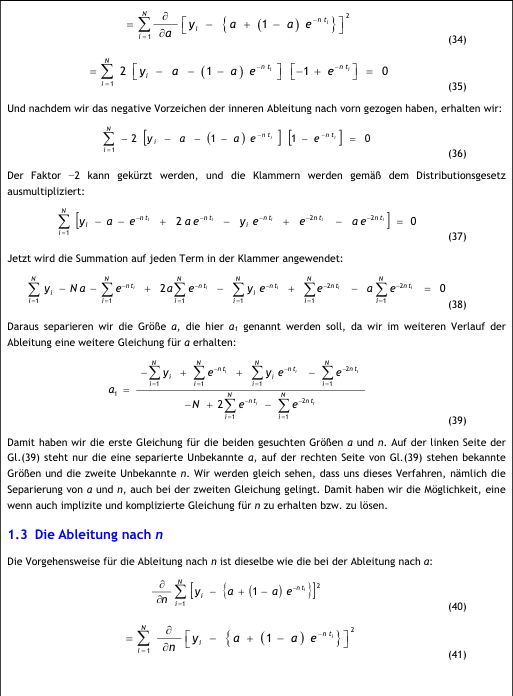
Appendix 2: Exponential Regression
References
1
EC Guide to Good Manufacturing Practice for Medicinal Products, entered into force on January 1, 1992, compiled by Gert AUTERHOFF, ECV Editio Cantor Verlag, Aulendorf, 1990, as a reprint from: Die Pharmazeutische Industrie, Vol. 52, No. 7, pp.: 853-883, 1990
2
EC Guide to Good Manufacturing Practice for Medicinal Products, compiled and edited by Gert AUTERHOFF, 2nd revised and expanded edition, ECV Editio Cantor Verlag, Aulendorf, 1993
3
EC Guide to Good Manufacturing Practice for Medicinal Products, compiled and edited by Gert AUTERHOFF, 3rd revised and expanded edition, ECV Editio Cantor Verlag, Aulendorf, 1994
4
EC Guide to Good Manufacturing Practice for Medicinal Products, compiled and edited by Gert AUTERHOFF, 4th revised and expanded edition, ECV Editio Cantor Verlag, Aulendorf, 1995
5
EC Guide to Good Manufacturing Practice for Medicinal Products, compiled and edited by Gert AUTERHOFF, 5th revised and expanded edition, ECV Editio Cantor Verlag, Aulendorf, 1998
6
EC Guide to Good Manufacturing Practice for Medicinal Products, compiled and edited by Gert AUTERHOFF, 6th revised and expanded edition, ECV Editio Cantor Verlag, Aulendorf, 2000
7
EC Guide to Good Manufacturing Practice, (http://pharmacos.eudra.org/F2/eudralex/vol 4/home.htm), Revision to Annex 1: Manufacture of Sterile Medicinal Products, adopted by Pharmaceutical Committee, May 2003, in operation September 2003
8
http://www.emea.eu.int/Inspections/ WhatsNew.html: What is NEW in Inspections Sector, communication dated 11/23/2005: Good Manufacturing Practice Annex 1: Proposals for Amendment to the Environmental Classification Table for Particles and Associated Text, London, September 21, 2005
9
http://www.fda.gov/cder/guidance/index.html: Guidance for Industry: Sterile Drug Products Produced by Aseptic Processing – Current Good Manufacturing Practice, September 2004
10
DIN EN ISO 14644-3, Draft, December 2002: Cleanrooms and associated controlled environments, Part 3: Test methods, 70 pages
11
ISO / FDIS 14644-3:2004(E = English): Cleanrooms and associated controlled environments, Part 3: Test methods, prepared as Document N 161 by ISO TC 209/SC/WG 3, 2004-11-5
12
ISO 14644-3:2005(E): Cleanrooms and associated controlled environments, Part 3: Test methods, first edition, December 15, 2005
13
VDI 2083-2:1996: Cleanroom technology, construction, operation and maintenance, 27 pages
14
RYDBERG, J. and KULMAR, E.: Ventilation effect with different placements of air inlet and air outlet openings, Installation, Vol. 19, pp.: 165-170, 1947.
15
Max von PETTENKOFER: On Ventilation or Air Change in Residential Buildings, Munich Calendar for the Year 1886
16
LINGNAU, J. et al.: EEC-Guide to Good Manufacturing Practice for Medicinal Products/Supplementary Guidelines/Manufacture of Sterile Medicinal Products: Air Classification System, Discussion of Purity Grade Requirements, Pharmazeutische Industrie, Vol. 51, Issue 12, pp.: 1380-1384, 1989
17
ZIEMER, W.; SCHENDERLEIN, S.: Particle Size Distribution in Pharmaceutical Classrooms, Environmental Engineering, Vol. 7, No. 3, pp.: 22-29, 1994
18
ZIEMER, W.; SCHENDERLEIN, S.: Particle Size Distribution in Pharmaceutical Classrooms, Proceedings of the 12th ISCC (International Symposium on Contamination Control), pp.: 79-86, October 10-14, 1994, Pacific Convention Plaza, Yokohama, Japan